The flip of the calendar to July 1, 2026, was supposed to bring a fresh quarterly start for the crypto markets. Instead, it delivered a brutal reality check. Bitcoin ($BTC$) has officially opened the second half of 2026 by sliding to $57,800 marking its lowest price level in over 21 months (652 days to be exact).
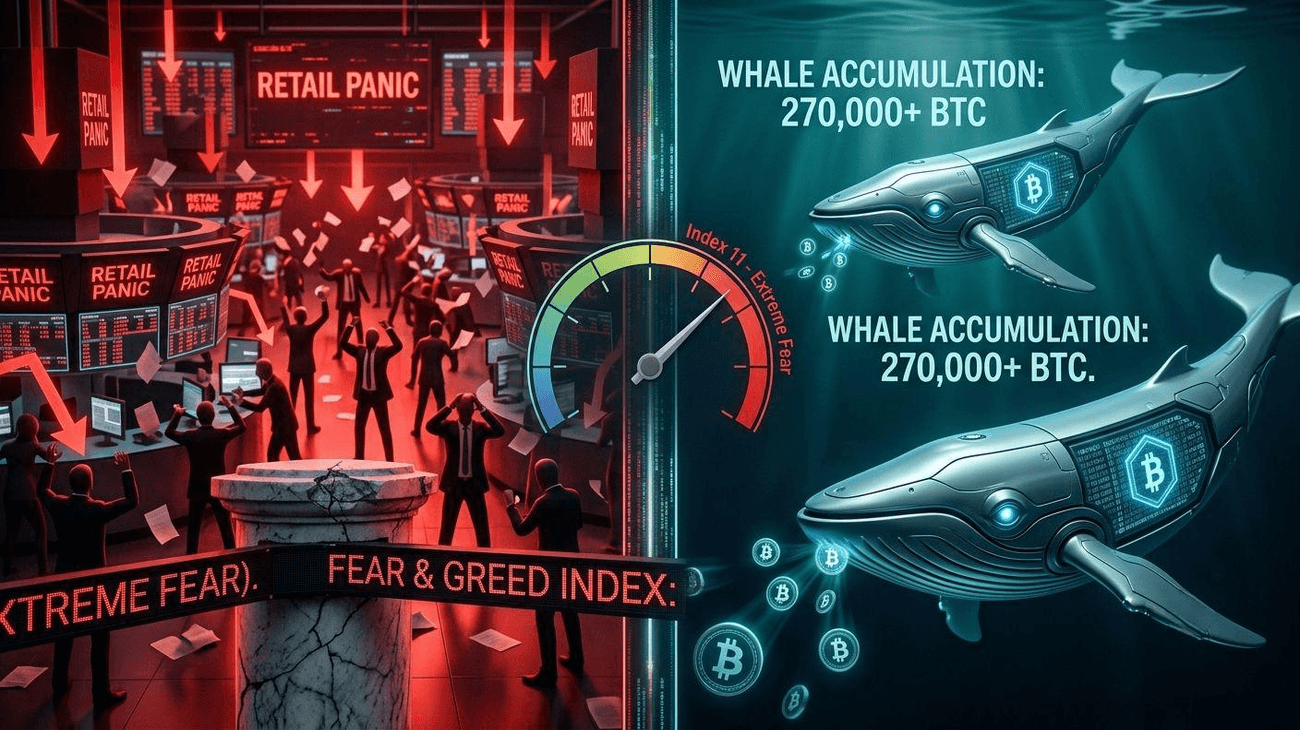
As a result, the market sentiment has completely collapsed. The Crypto Fear & Greed Index has plunged to a jaw-dropping 11 out of 100, signaling a state of Extreme Fear.
But beneath this sea of red, an incredible anomaly is taking place. While everyday retail investors are panic-selling, institutional giants and mega-whales are playing a completely different game. Here is a research-backed breakdown of what is actually driving the H2 2026 bloodbath, and why the smart money isn’t looking at the exit doors.

Bitcoin hits a 21-month low as record-breaking institutional ETF outflows trigger market-wide capitulation.
Quick Takeaway (For the Fast Reader)
-
The Reality: BTC opened H2 2026 at its lowest since late 2024, closing June down over 20%.
-
The Culprit: US Spot ETFs experienced a historic, record-shattering $4.5 Billion in net outflows throughout June, led by massive liquidations in BlackRock’s IBIT.
-
The Anomaly: A massive Whale Divergence has appeared. While retail is panic-selling, mega-wallets have quietly accumulated over 270,000 BTC in the last two weeks.
-
The Line in the Sand: $58,000 is the ultimate make-or-break level. Holding it triggers a macro divergence rebound; losing it opens a technical trapdoor straight down to $40,000.
1. The Institutional Exodus: Why $4.5 Billion Left the Building
When US Spot Bitcoin ETFs launched back in January 2024, they were hailed as the ultimate vehicle for infinite institutional inflows. By late 2025, they had driven Bitcoin to an all-time high of $126,272. However, June 2026 proved that what goes up can come down just as fast.
According to verified data from SoSoValue and Coinglass, US Spot Bitcoin ETFs suffered $4.51 Billion in net outflows during June 2026. This isn't just a regular pullback it is officially the worst monthly performance in ETF history, completely eclipsing the previous record outflow of $3.56 billion from February 2025.
[June 2026 ETF Outflow Breakdown]
Total Category Outflow: ──► $4.51 Billion (New Record)
BlackRock (IBIT) Share: ──► $3.55 Billion (~79% of total selling pressure)
BlackRock’s iShares Bitcoin Trust (IBIT) single-handedly bore the brunt of this institutional retreat, accounting for roughly 79% ($3.55 billion) of the total redemptions.
Why did institutions run away?
The macroeconomic environment shifted violently. In early June, the US Federal Reserve removed key language from its statement that previously hinted at imminent interest rate cuts.With interest rates staying higher for longer, institutional capital rotated out of "risk-on" assets like cryptocurrency and flooded straight into traditional US Dollar assets and skyrocketing AI tech stocks.
2. The Whale Divergence: Retail Panic vs. Smart Money Smugness
While the headline numbers look terrifying, the on-chain data paints a completely opposite picture. We are currently witnessing one of the largest "Whale Divergences" in crypto history.
While retail traders are capitulating out of fear, institutional and private whales (wallets holding 1,000 to 10,000 BTC) are viewing this $57k–$58k region as a massive discount zone.
On-chain metrics provided by CryptoQuant reveal that Bitcoin whales aggressively accumulated over 270,000 BTC over the final two weeks of June alone.
This creates a textbook market divergence:
-
Market Sentiment: Making lower lows (Fear & Greed Index hitting an absolute cycle low of 11).
-
Whale Holdings: Making higher highs (Aggressive supply absorption off exchanges).
Historically, when extreme retail fear meets aggressive whale accumulation, it indicates that the market is carving out a cyclical bottom. The liquidations are transferring Bitcoin from "weak, leveraged hands" into "strong, spot-holding hands."
3. Technical Warning: The $58,000 Trapdoor to $40,000
From a pure technical analysis standpoint, Bitcoin is currently balanced on a knife's edge. The region between $58,000 and $58,513 represents a critical macro monthly support level that dates back nearly two years.
The $58,000 Break Point
-
Above $58,000 (Bullish): ETF inflows and Whales buying will cause a rebound.
-
Below $58,000 (Bearish): Mass panic and liquidations will crash the price to $40,000.
Prominent market analysts, including veteran macro strategists, are warning that this structure must hold on the higher timeframes to prevent a structural breakdown.
Scenario A (The Bear Case):
If Bitcoin prints a decisive weekly close below $58,000, it will trigger an avalanche of stop-losses and automated liquidations from over-leveraged long positions. In this worst-case scenario, the next major historical liquidity pool and volume profile support doesn't show up until the $40,000 zone—representing an additional 30% drop from current prices.
Scenario B (The Bull Case):
If the spot ETF selling pressure exhausts itself in the first week of July, the massive structural demand from the whale accumulation will kick in. Because the market sentiment is deeply oversold at Index 11, even a small shift back to neutral ETF flows could trigger a massive "short squeeze," rocketing BTC back above the $60,000 psychological threshold.
Conclusion: Is This the End or the Ultimate Discount?
H2 2026 has opened with blood in the streets, but a deeper look past the scary headlines shows that the underlying network architecture is simply changing hands. The institutional ETF tourists who bought the top are being flushed out by macroeconomic shifts, while long-term whales are quietly swallowing up the float.
Whether $58,000 holds or we take a painful detour to $40,000, the data proves one thing: Bitcoin is currently being re-priced for its next major macro cycle. Position your risk accordingly.
Verifiable Research Sources:
-
ETF Flow Data: SoSoValue Metrics & Coinglass Spot Bitcoin ETP Trackers (Update: July 1, 2026)
-
On-Chain Whale Accumulation: CryptoQuant Real-Time Exchange Outflow & Whale Wallet Cohort Metrics (June/July 2026)
-
Sentiment Tracking: Alternative.me / CoinMarketCap Crypto Fear & Greed Index (Registered at 11 on July 1, 2026)
-
Historical Price Action: TradingView / Finbold Market Intelligence Report (July 1, 2026)
Disclaimer: This post is for educational and research purposes only and does not constitute financial advice. Always do your own research (DYOR).
⚡ Never miss an urgent market shift: I post daily real-time crypto setups, micro-analyses, and exclusive charts. Follow My Daily Updates Here
🎮 Want to turn your gaming time into passive income?
👉 Start Your Crypto Mining Journey Now


