
The global cryptocurrency market has entered a high-stakes phase as June 2026 begins. After weeks of battling macroeconomic headwinds and shifting institutional flows, both Bitcoin ($BTC$) and Ethereum ($ETH$) are hovering at critical technical junctures. Traders worldwide are asking one fundamental question: Is this severe consolidation a consolidation before an explosive breakout, or are we on the verge of a deeper structural breakdown?
To answer this, we must look beyond the daily noise and dissect the raw data analyzing key support/resistance zones, RSI divergence, MACD momentum, and the institutional catalysts shaping the charts this week.
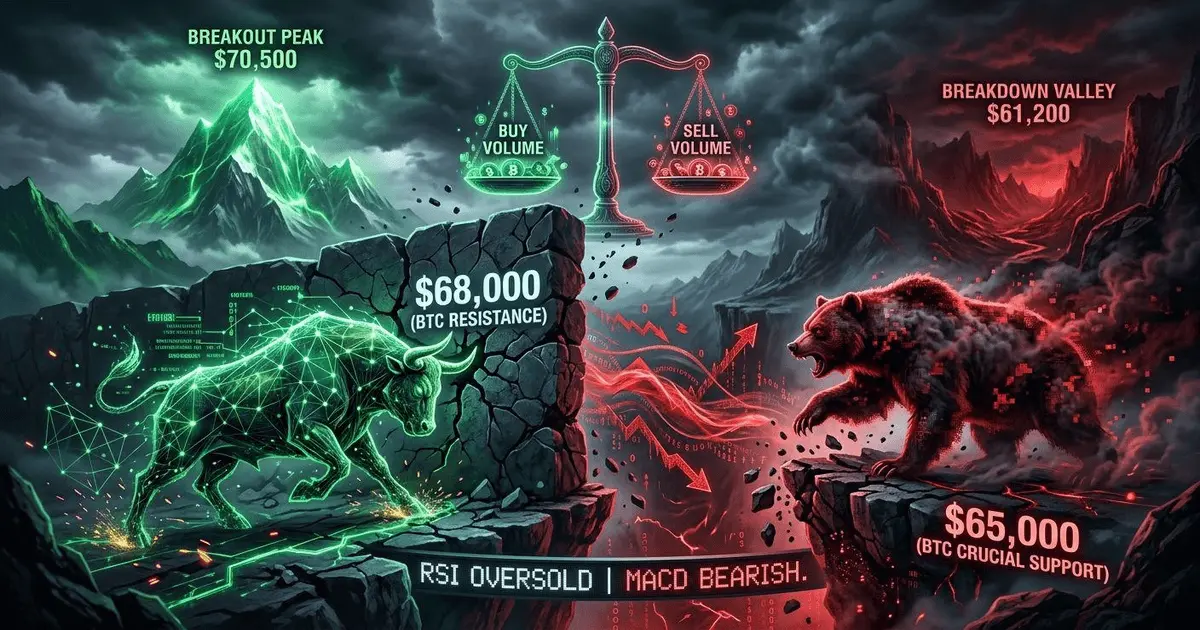
Visualizing the high-stakes battle between bulls and bears shaping the next major market move.
⚡ Quick Takeaway & Market Map
If you are scrolling past the deep charts, here is the immediate trading reality for the first week of June 2026:
-
The Big Picture: The broader crypto market faces a temporary risk-off environment driven by over $400 million in ETF outflows and delayed Federal Reserve rate cut expectations.
-
Bitcoin ($BTC$): Currently trading under pressure near $66,500. A daily close below $65,000 risks a breakdown toward $61,200. Conversely, bulls must reclaim $68,000 to trigger a short-term reversal.
-
Ethereum ($ETH$): Fighting a tough battle just under the psychological $2,000 level (currently around $1,970). If the $1,800 support fails, a correction toward $1,675 is highly probable.
Bitcoin (BTC/USDT): Bears Fight to Break the Macro Trend
Bitcoin's recent price action has kept swing traders on edge. After failing to sustain ground above the $70,500 resistance zone late last month, a sudden 6% daily plunge broke the short-term ascending recovery channel established since early spring.
[Resistance 2] -- $70,500 (Major Psychological Wall)
[Resistance 1] -- $68,000 (20-Day EMA & Trendline Re-test)
|
PRICE -- Currently hovering around $66,500
|
[Support 1] -- $65,000 (Crucial Higher-Low Anchor)
[Support 2] -- $61,200 (Macro Demand Zone)
Technical Indicators Deep Dive:
-
Moving Averages: BTC has slipped below its 20-day and 50-day Exponential Moving Averages (EMA). This shifts the short-term bias to bearish, turning previous support lines into overhead resistance.
-
RSI (Relative Strength Index): On the daily chart, the RSI has slid significantly into the 24–28 zone. While this technically flags Bitcoin as "deeply oversold," smart traders know that oversold conditions can remain sticky during a structural trend shift. It suggests a relief bounce is due, but it requires volume confirmation.
-
MACD (Moving Average Convergence Divergence): The MACD line has crossed decisively below the signal line into negative territory, with the histogram printing expanding red bars. This reinforces that downward momentum still has the upper hand.
The Trade Setup: Watch the $65,000 level like a hawk. A clean breakdown here triggers a short opportunity down to $61,200. If bulls manage to defend this area and push the price back above $68,000, it invalidates the bearish bias and opens the door to retest $70,500.
💎 Ethereum (ETH/USDT): The Battle for the $2,000 Floor
Ethereum's narrative right now is a fascinating clash between weak short-term price action and robust network fundamentals. Despite optimism surrounding the recent Pectra upgrade and expanding staking participation, a sharp reversal in spot Ethereum ETF flows has pushed the asset into a multi-week downtrend.
ETH opened May strong but closed the month down roughly 13%, sliding below its key $2,100 structural anchor to its current position at $1,972.
Technical Indicators Deep Dive:
-
The $2,000 Psychological Pivot: Ether is struggling to reclaim the $2,000 mark. On-chain data indicates a heavy cluster of liquidations sitting just below this level, making it a high-volatility zone.
-
RSI Analysis: The daily RSI sits at 32, hovering just above the official oversold threshold. This indicates that while selling pressure has been relentless, the asset is reaching a valuation where historical buyers typically step in.
-
MACD Momentum: Much like Bitcoin, Ethereum's daily MACD shows a sustained bearish crossover. The lack of buying volume near the Fib 0.236 retracement zone (around $2,500) earlier in May means the path of least resistance remains skewed to the downside for now.
The Trade Setup:
-
Bearish Scenario: If ETH fails to hold the immediate $1,800 support, the floodgates open for a swift correction toward the $1,675 macro liquidity pool.
-
Bullish Scenario: A daily close with high volume above $2,100 is required to break this grueling downtrend and shift the market structure back to a bullish expansion phase.
📊 Structural Divergence: A Silver Lining for On-Chain Bulls?
While the price charts look undeniably stressful for short-term traders, long-term on-chain metrics reveal a massive divergence. Data tracking Ethereum performance over the last 28 days shows that despite a 13.1% decline in price, the total number of unique ETH tokenholders grew by over 4.1 million (+1.33%).
This tells us a crucial secret about the current market structure: Smart money and retail accumulators are treating this dip as a long-term buying opportunity. They are absorbing the supply shed by institutional ETF outflows.
Verification & Research Sources
To ensure total accuracy, the technical structures and market data discussed in this analysis are synthesized from verified financial and market tracking institutions as of June 3, 2026:
-
Macro & ETF Flow Data: Asset outflow and institutional sentiment tracking via Capital.com (Ether Price Outlook Report, June 2026) and IG Market Insights.
-
On-Chain Metrics & Tokenholder Analytics: Statistics regarding monthly active users and holder accumulation distribution pulled via Investing.com (Ethereum Performance Analysis Report, late May/early June 2026).
-
Price Action Data: Live spot market data mapped directly from TradingView (BTC/USDT and ETH/USDT daily feeds).
Disclaimer: This post is for educational and research purposes only and does not constitute financial advice. Always do your own research (DYOR).
⚡ Never miss an urgent market shift: I post daily real-time crypto setups, micro-analyses, and exclusive charts. Follow My Daily Updates Here
🎮 Want to turn your gaming time into passive income?






