
⚡ Quick Takeaways:
Institutional Pivot: After facing nearly $8 Billion in cumulative outflows through late Q2 2026, spot Bitcoin ETFs have flipped net positive, pulling in over $930 Million across recent consecutive trading sessions.
BlackRock’s Dominance: BlackRock’s IBIT continues to lead the institutional recovery, recording single-day inflows upwards of $136 Million.
On-Chain Resistance: On-chain data from Glassnode shows Bitcoin reclaiming the $65,000 level. However, the real test sits at the $68,500 – $69,000 range (Short-Term Holder Cost Basis).
The Verdict: While the shift signals that forced institutional selling has exhausted, low spot volume suggests the market is in a consolidation phase rather than a full-blown parabolic rally.
1. The Institutional U-Turn: Reversing the $8B Bleed
The second quarter of 2026 delivered one of the most grueling correction phases since the approval of US spot Bitcoin ETFs. Led by defensive macro repositioning, elevated real yields, and institutional profit-taking, spot ETFs endured an aggregate drawdown exceeding $8 Billion in capital flight.
However, market dynamics flipped sharply this July.
Across a series of aggressive buying sessions, spot Bitcoin ETFs absorbed over $930 Million in net inflows. BlackRock’s iShares Bitcoin Trust (IBIT) spearheaded this turnaround, recording $136 Million in a single day confirming that institutional asset managers are stepping back into accumulation mode rather than liquidating holdings.
Institutional ETF Dynamics
-
Q2 Outflows vs. Surge: After an $8.0B drain in Q2, institutional money pivoted hard with +$930M+ in net inflows.
-
Key Buyers: Heavy accumulation driven by BlackRock (IBIT) and Fidelity (FBTC).
-
Immediate Support ($63.5K – $64K): The key demand floor holding current market structure.
-
Major Resistance ($68.5K – $69K): The critical breakout zone aligned with the Short-Term Holder cost basis.
2. On-Chain Reality Check: What Glassnode Data Reveals
While ETF inflow numbers headline the news, on-chain metrics paint a more nuanced picture of market health.
According to latest intelligence from Glassnode Research:
-
Futures & Options Open Interest: Aggregate futures Open Interest has climbed back toward $32 Billion, alongside $30.1 Billion in options Open Interest. The compression in implied volatility indicates that options traders are no longer paying excessive premiums for downside protection (put options).
-
Short-Term Holder (STH) Cost Basis: The average cost basis for investors who bought over the last 155 days sits near $68,800. Historically, whenever Bitcoin trades below this cost basis, it acts as a stubborn overhead supply wall. Reclaiming this level is critical to converting resistance into support.
-
Spot Volume Divergence: Spot market volumes remain below the $4.5 Billion statistical threshold. This indicates that while institutional money floor is holding price up via ETFs, retail spot buyers are still sitting on their hands, waiting for macro clarity.
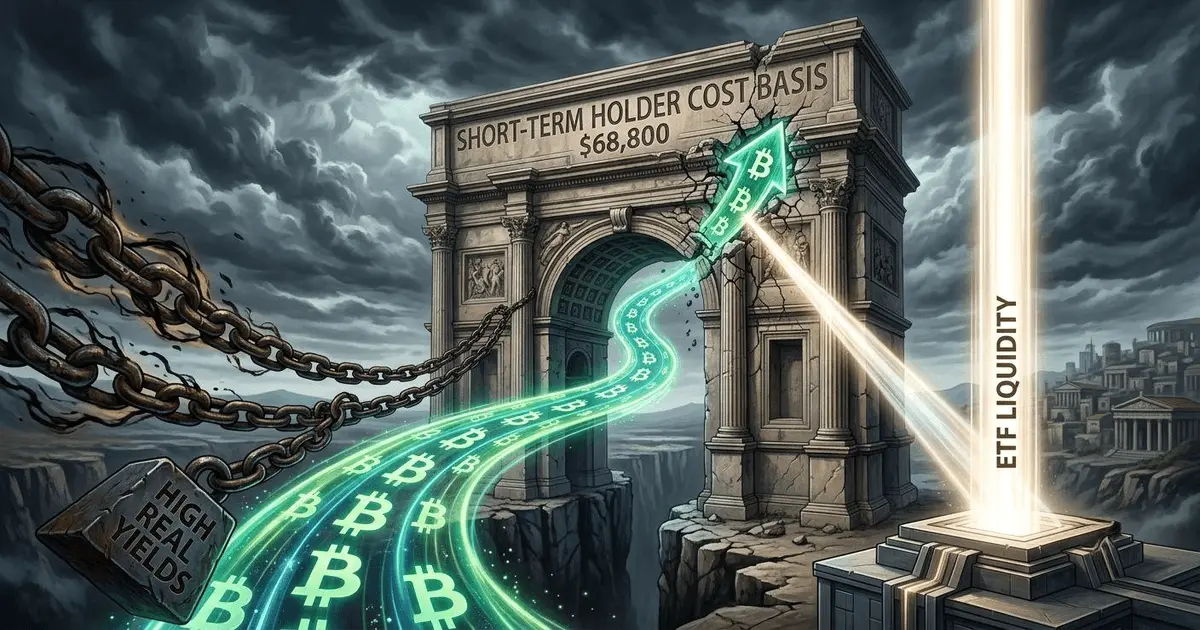
Bitcoin tests the critical $68,800 short-term holder cost basis amid macro pressures.
3. Bullish Trigger vs. Macro Risks
Is the correction officially over, or are we witnessing a sophisticated bull trap?
The Bullish Case
-
Absorption of Overhead Supply: The $930M+ ETF influx proves that dip-buyers are actively capping localized bottoms around $58,000–$60,000.
-
Derivatives Stabilization: Perpetual funding rates have stabilized near neutral levels without high leverage, reducing the probability of long-squeeze cascades.
The Bearish Risks
-
Macro Drag: Ten-year US real yields remain high around 2.4%, keeping pressure on non-yielding risk assets.
-
Energy & Geopolitics: Crude oil spikes and geopolitical tensions continue to limit aggressive upside momentum across broader global markets.
4. Final Verdict for Traders & Investors
The $930 Million ETF inflow turnaround confirms one major structural takeaway: the systematic institutional panic selling has paused.
However, for the bull market to resume its parabolic trajectory, spot volume must expand, and Bitcoin must convincingly close above the $68,800 Short-Term Holder wall. Until then, expect a range-bound consolidation phase between $63,000 and $68,000.
Verified Research & Data Sources
To uphold full research transparency, data in this article was cross-referenced from:
-
Glassnode Studio & Weekly On-Chain Reports: Institutional Capital Tracking & Short-Term Holder Cost Basis Data.
-
SoSoValue & Farside Investors: US Spot Bitcoin ETF Flow Analytics (IBIT, FBTC, BITB).
-
Bloomberg ETF Intelligence: Institutional Fund Flows & Asset Ratios.
Disclaimer: This post is for educational and research purposes only and does not constitute financial advice. Always do your own research (DYOR).
⚡ Never miss an urgent market shift: I post daily real-time crypto setups, micro-analyses, and exclusive charts. Follow My Daily Updates Here
🚀 Duplicate CryptoVault Now: Grab your automated Notion Trading Journal here for 50% OFF with code LAUNCH26
👉 Stop trading blindly: Secure your CryptoVault on Gumroad now to master your risk analytics and protect your capital.
🎥 Bonus Creator Tools: Free Crypto Editing Assets
If you create crypto updates, TikTok reels, or YouTube Shorts based on today’s market analysis, use these editing templates:
-
Free CapCut Crypto Presets (Notion Library) – Download customized editing presets on Notion to style your charts & market reels.





