
The Open Network (TON) has been one of the most talked-about ecosystems this year, but the price action is currently telling a story of intense compression. As $TON consolidates, the question isn't if it will move, but which way the explosion will go.
At Technology Era, we analyze the confluence of patterns and indicators. Here is why TON is currently a "patience-first" trade.
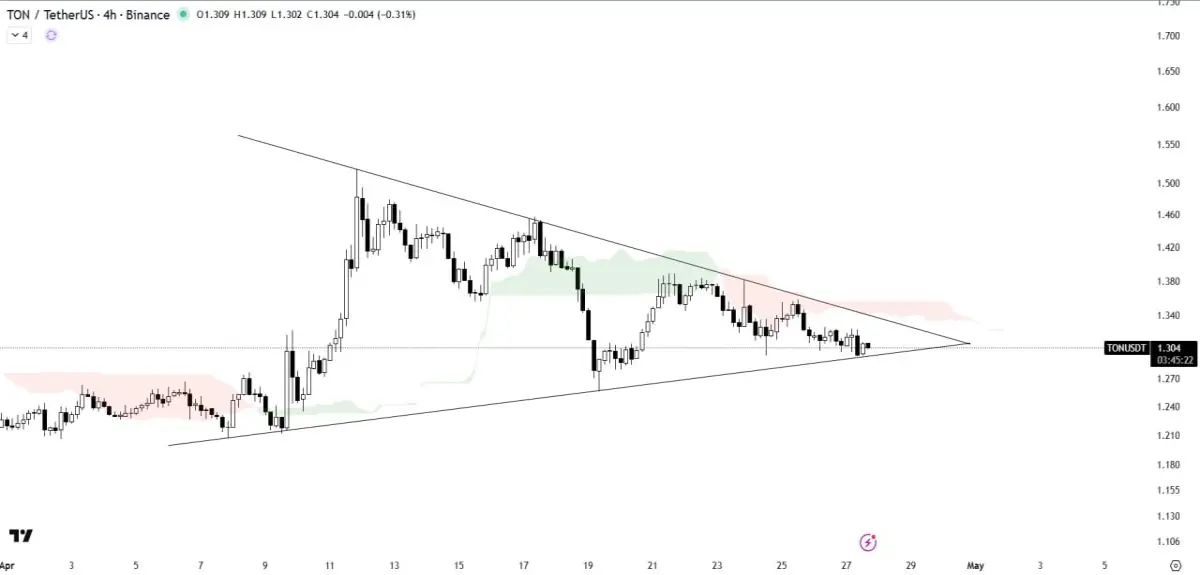
1. The Symmetrical Triangle: A Coil Ready to Spring
On the charts, TON is printing a classic Symmetrical Triangle pattern. This represents a period of indecision where both bulls and bears are tightening their grip.
-
Support Trendline: The price is currently hugging the lower support line. As long as this holds, the bullish structure remains intact.
-
Resistance Pressure: Every attempt to bounce is being met with lower highs, showing that sellers are still active.
2. The Ichimoku Cloud Barrier
The "Cloud" doesn't lie. Currently, the Ichimoku Cloud is sitting right above the price, acting as a heavy resistance ceiling. This cloud is effectively suppressing the upside momentum.
-
To flip bullish, we need to see the price break through the cloud and turn it into support. Until then, any pump might just be a "dead cat bounce."
3. The Strategy: Wait for the Breakout
Trading inside a triangle is like gambling on a coin toss. The professional approach is to wait for a decisive candle close:
-
Bullish Trigger: A breakout above the upper trendline and the Ichimoku Cloud. This could open the doors for a massive rally.
-
Bearish Risk: A breakdown below the support trendline could lead to a quick flush out to deeper liquidity zones.
Final Verdict: Patience is your greatest asset right now. Don't chase the noise wait for the market to reveal its hand.
All technical analysis and content in this post are original and provided by Technology Era. Visual assets "Thumbnail" are AI-generated specifically for this publication.






