
On June 7, Bitcoin rebounded from the support area of $ 9,450 and began to strengthen. The price is traded inside the resistance area, the breakdown of which can provoke a rapid growth of the currency.

Current support
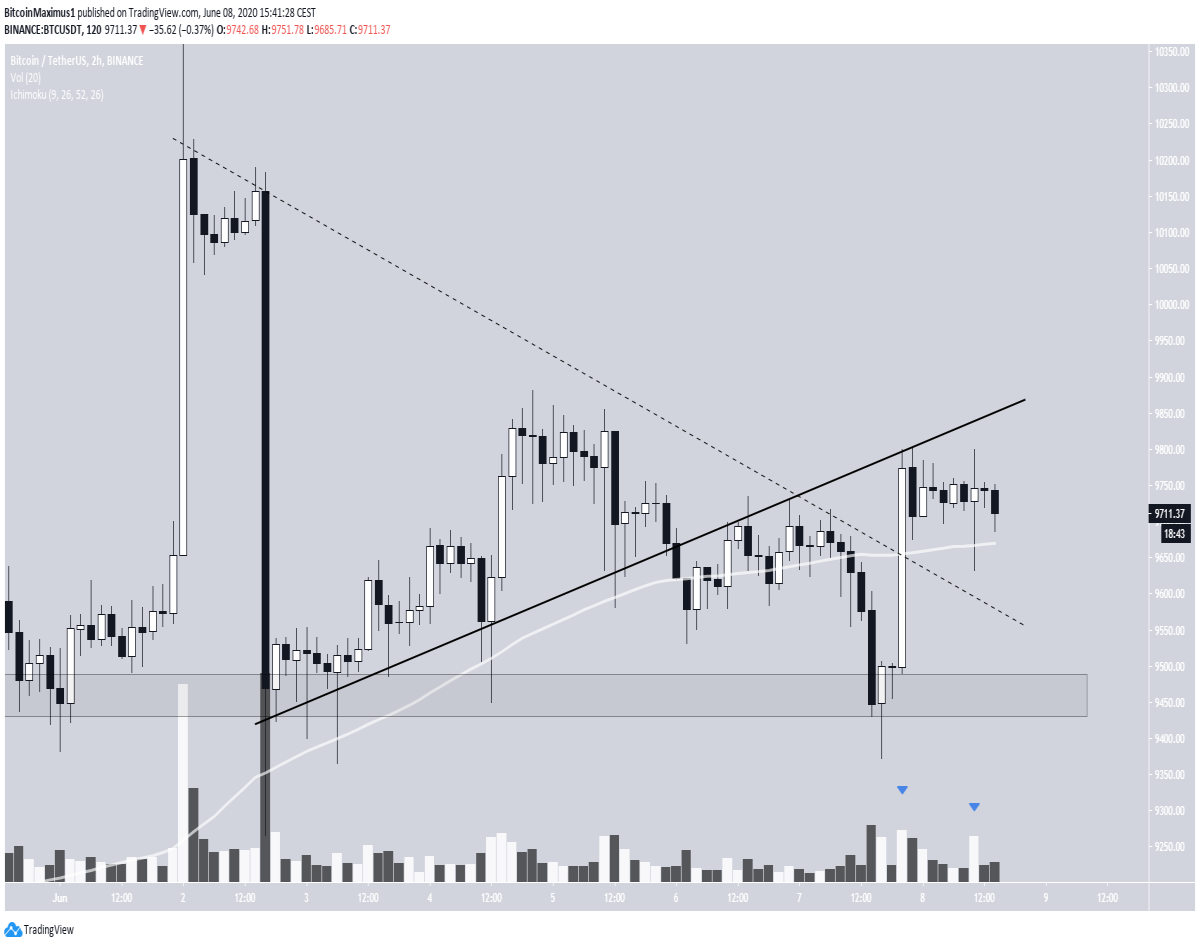
The Bitcoin exchange rate (BTC) moved along the line of upward support, which appeared on the chart on June 2, but on June 5, the price broke through this line. The next day, the market returned to her, to test it already as resistance, and then the pair sharply rolled back.
However, having reached the support area of $ 9,450, the price reversed and began to rise, breaking through the downward resistance line drawn from the June 1 high (dashed line) and forming a bullish absorption candle.
This bullish breakout was accompanied by significant trading volumes. The pair also recovered above the 200-hour moving average (MA).
In this regard, continued growth of Bitcoin is possible and a quick recovery over the previous line of upward support.
Cryptocurrency trader @Scottmelker shared with his readers a chart depicting a similar support line and noted:
“We returned directly to the resistance. This line was support, in the area of which I came out of my last long. Let's see what will happen next".

What will happen next
Despite the growth described above, the BTC rate still formed a falling maximum relative to the price dynamics on June 4, when the price touched the Fibo level of 0.5.
Two options are possible:
- Bullish scenario (more likely). The pair will grow in the direction of the following resistance levels at $ 9950 and $ 10,110 (Fibo levels of 0.618 and 0.765, respectively). Growth above the last level (red line) may signal a correction and will aim the market at new highs.
- Bearish scenario. It is implemented in case of a drawdown below the $ 9450 area. Such dynamics can cause a rapid drop significantly below $ 9000.
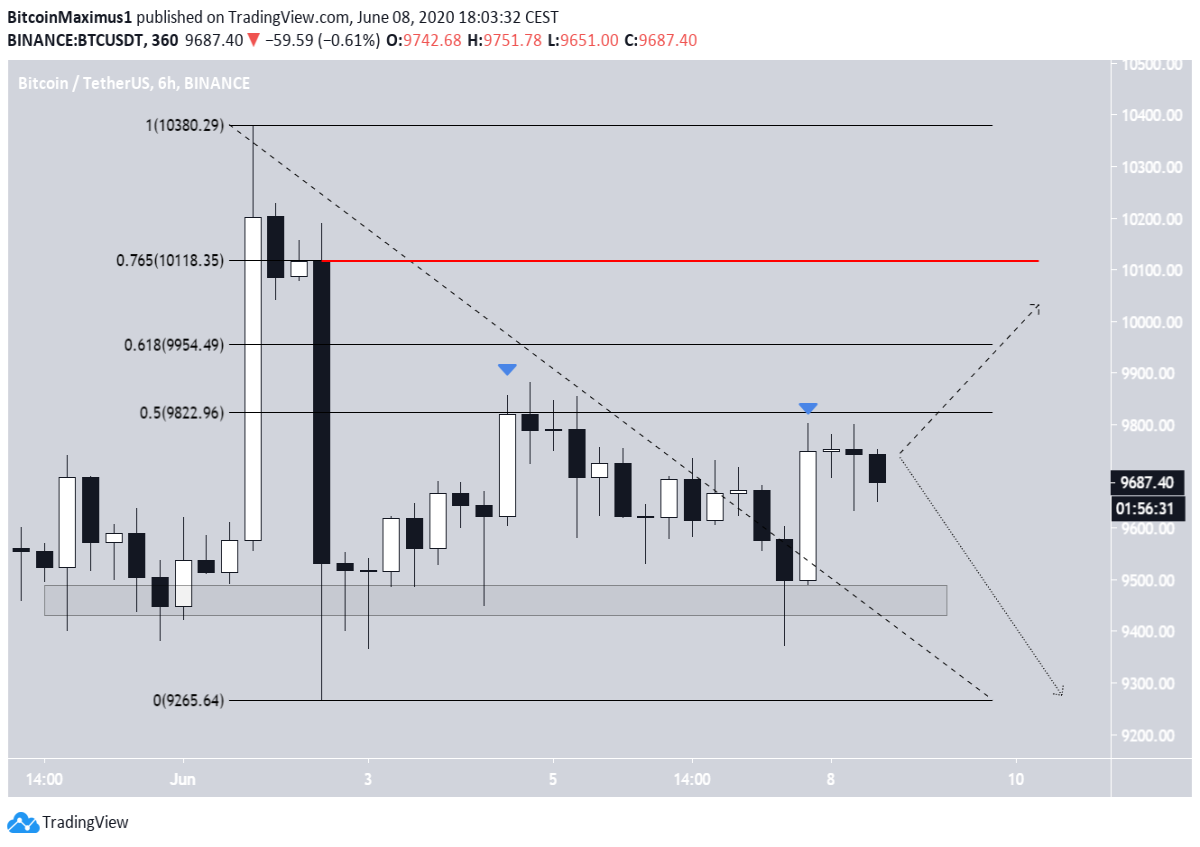
I predict such a sharp decline, since the support area of $ 9,450 coincides with the line of long-term upward support that appeared on the chart on March 13. A breakdown of this level can lead to a sharp weakening of BTC.
On the other hand, in the areas of $ 9,950 and $ 10,100 are highs from May 6 and May 1, respectively. Most likely, when / if the price reaches these levels, it will have to turn around, however, their bullish breakdown will signal the completion of the correction and aim the bulls at new highs.
An important long-term resistance is located in the region of $ 10,400, but if the price reaches it, this will be the fourth touch, so a bullish breakdown is quite possible, since each testing weakens the support / resistance areas more and more.
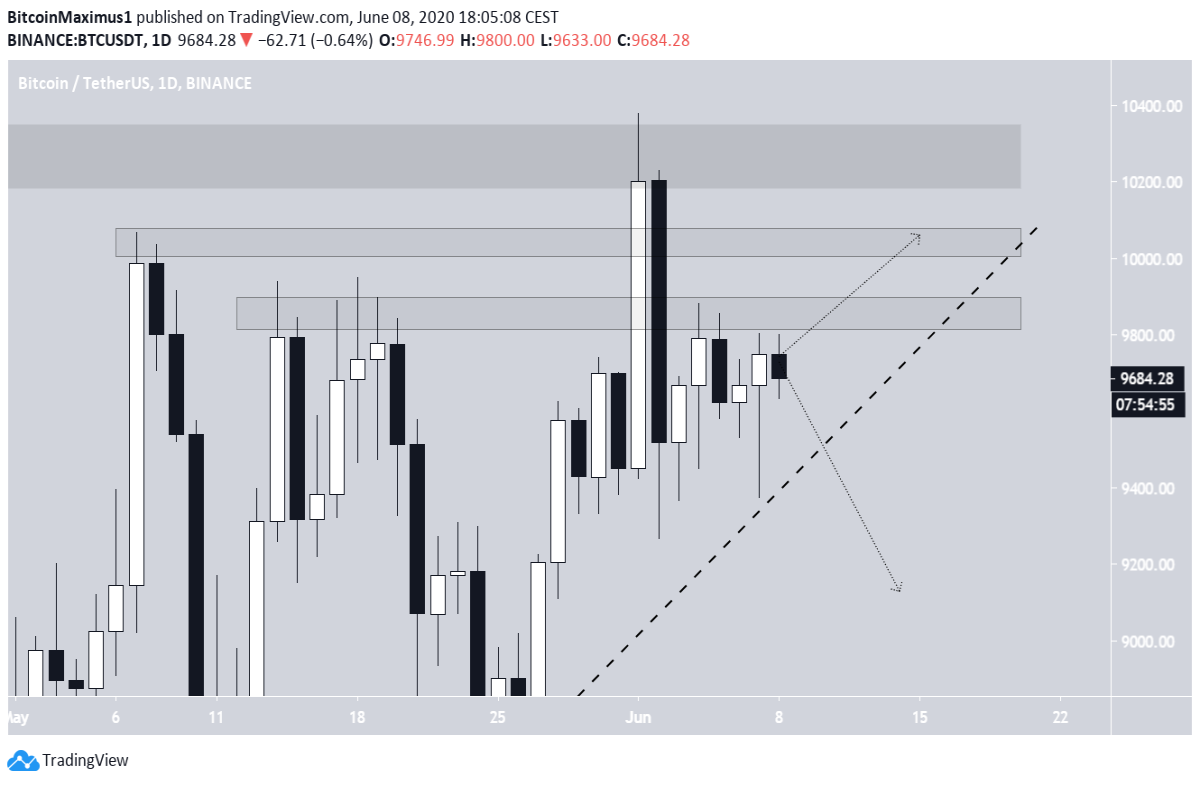
Thus, the long-term direction of the Bitcoin exchange rate is still shrouded in a fog of uncertainty. An increase above $ 10,100 will be regarded as a signal of a bullish trend, and a fall below $ 9,450 will be considered an indication of a bearish trend.
Which camp did you join - bulls or bears? Why? Share your opinion in the comments!


