
At the time of writing, Bitcoin is trading at $46,458.
In this post, I will analyse why Bitcoin will most likely drop to $41,000 in the next few days and perhaps lower.
Bitcoin has today dropped below yesterday's close price of $47,088, which was a major support level.
After the drop on 22nd February, the BTC/USD pair had another red day on the 23rd and on the 24th it had an inside bar day. From the inside bar day, we are looking for confirmation of a higher or lower move.
Looking at the Daily chart below, we can see that he daily candlestick closed below the 21 Daily EMA yesterday (yellow line) and has continued falling in price.
The inverted hammer combined with higher selling volume indicates that a bearish scenario might be in place.

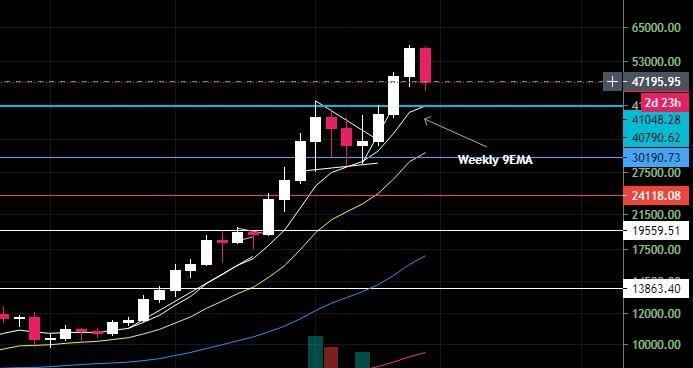
Looking at the Weekly BTC/USD chart, Bitcoin is slightly overextended and away from its 9EMA. The Weekly 9EMA acts as a magnet support in bullish markets.
In the chart below, we can see that BTC has not had a close below the Weekly 9MA since September last year and has not touched it for a while.
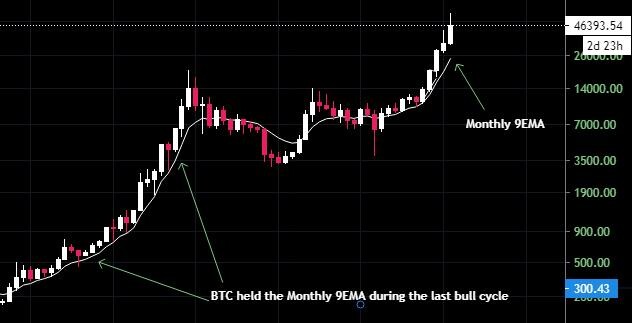
Similarly, the Monthly 9EMA looks overextended. We can see from the last cycle how the the Monthly 9EMA acted as major support in 2017 and acts as a magnet to its pice.
In conclusion, the BTC/ISD chart looks heavy and looks bearish. A downward move to $41,000 looks likely and healthy before a continuation to the upside if it can hold the $41,173 suppport level and Weekly 9EMA.


![[The Gas Matrix]: How Ethereum’s Latest Scaling Upgrades Are Changing the Math of DeFi Yield Farming](https://www.publish0x.com/img/1182699.png?action=resize&ar=1&h=191&inv=0&ori=1&st=1&up=1&w=340&signature=eab77194fd7063a0d9e240ba0e69a48364989b0c6ba087a7e7fbc35561c2be17)


