
What market phase are we entering into has been the introduction question of the last appointments. But here, in the last week (like the earlier one) nothing so relevant happened. So I will be quiet brief.
Let’s start from our usual weekly perspective
Weekly chart
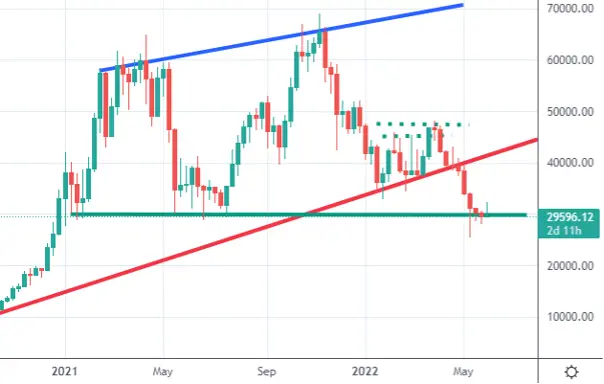
The weekly candle is reacting onto the green line, action now as a support and a potential liquidity pool that has created an upward rejection of the price that has been absorbed back.
What do I expect from a daily perspective?
Daily Chart
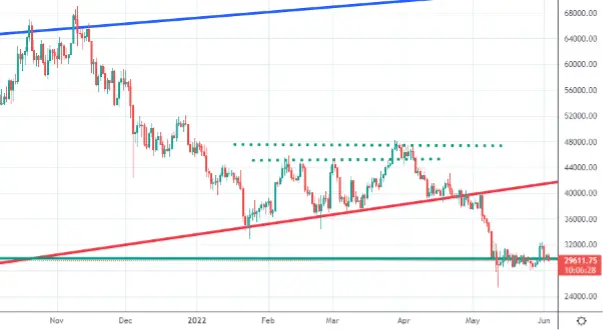
Here is a daily chart, where the usual continuous red and blue lines are still clearly visible.
Price is still ranging upon the Green Line, but this time a breakout upwards has been attempted. For the moment such movement has been reabsorbed and it could potentially be a bull trap to set some newbie trader up with that fake.
Daily Chart
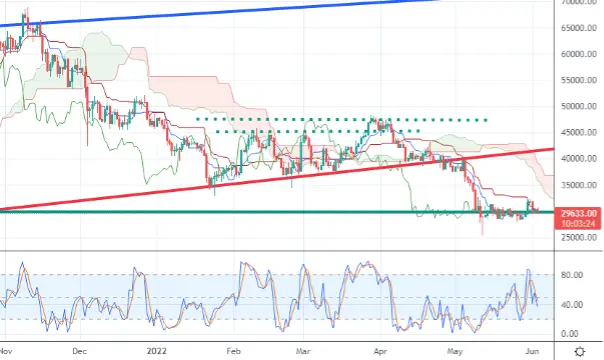
Ichimoku are now on a stable range and the price is getting closer to the Ichimoku area making a price reaction. Likely, I am expecting now a test downwards of the price and a potential bounce back. The moment is showing us a movement upwards of Gold that usually brings a contrary trend of Bitcoin. And that’s what we have seen in the last days.
What to observe particularly?
Stochastic is in a neutral area making it almost useless for such analysis.
The price is still in a very uncertain area so this time, but I would like to see a short squeeze before a nice bull trend.
Let me know what you think about this new weekly appointment, and what indicators you would like to be taken into consideration more (or even explained).
Stay tuned and be sure to follow to get noticed when my contents come out.






