
Really too good to be able to enter on the minimum and sell on the maximum! Unfortunately it is impossible to foresee all this.
But statistics can be of great help to us.
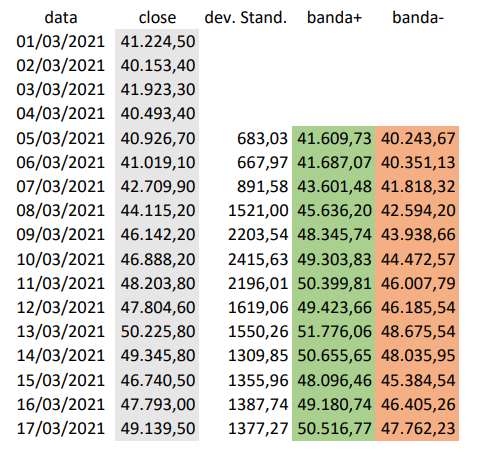
I created an excel sheet where I reported the Bitcoin closing price data from March 1st until March 17th yesterday.
The prices are in euros and I got them from https://it.investing.com/crypto/bitcoin/historical-data?cid=1057388
On the first column I entered the date, on the second the closing price, on the third I calculated the standard deviation over the last 5 periods.
The formula is: =DEV.ST(E2:E6).
The fourth column adds the closure with the deviation and the fifth column subtracts it.
In this way I get the values that create an upper and lower band like a bollinger band.
Up until now we have always come almost close. What do you think of using it for intraday trading together with some other moving average type indicator that gives us direction?
This is the outline of the sheet:
Let me know in the comments what you think, thanks.
This article does not contain investment advice. Every investment and trading move carries a risk, readers should conduct their own research when making a decision.
THE OPINIONS EXPRESSED BY THE AUTHOR ARE FOR INFORMATION PURPOSES ONLY AND DO NOT CONSTITUTE FINANCIAL, INVESTMENT OR OTHER ADVICE.
Open a Coinbase account to get bonuses:
https://www.coinbase.com/join/carote_7
Log in to Publish0x:
https://www.publish0x.com/?a=oQeZ4DR6bp
Open an account with Kucoin use my code: rJEUMUV


