
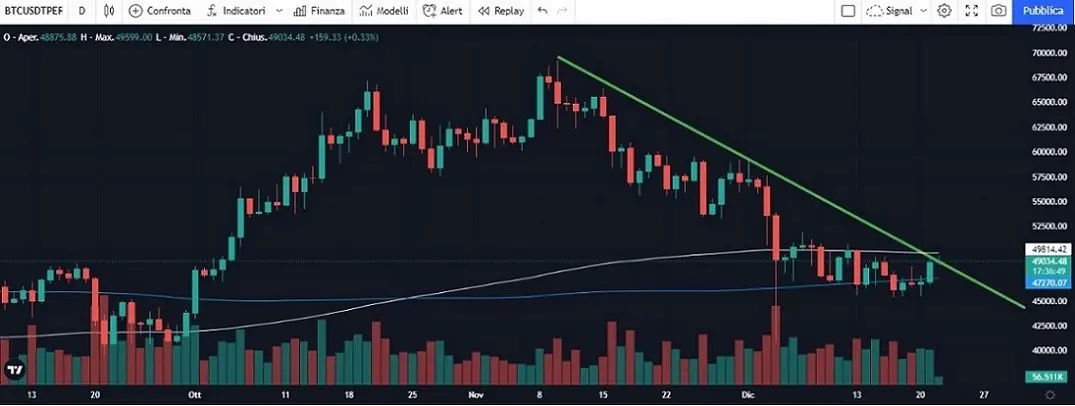
We are above the simple moving average (blue line) around 47300, next exponential moving average resistance 200 (white line), volumes slightly increasing but not too much to give a bullish push. When the trend line with increasing volumes is overcome, I expect a nice rise. Important support 44500.
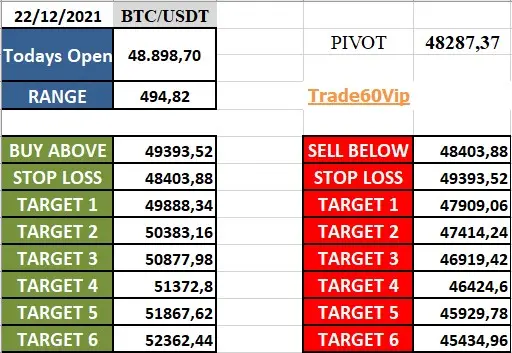
As usual I am attaching levels for intraday trading on BTCUSD.
How to interpret the levels?
I use them like this, I use a time frame of 30 minutes and with a close of the candle above the BUY ABOVE price I go long with the relative targets. And the indicated stop loss. I consider the first three targets the most important ones.
A short opening occurs with a price below SELL BELOW with the relative targets and the stop loss.
For further analysis and trading ideas follow me on Patreon, you will also have a dedicated VIP telegram channel (in Italian, to be translated) https://www.patreon.com/mariocarotenuto Today you will find intraday levels for ethereum and moon as well as a beautiful book on Japanese candles.
Log in to Publish0x:
https://www.publish0x.com/?a=oQeZ4DR6bp
Open an account with Kucoin use my code: https://www.kucoin.com/ucenter/signup?rcode=rJEUMUV
Open a Coinbase account to get bonuses 10$
https://www.coinbase.com/join/carote_7
This article does not contain investment advice. Every investment and trading move carries a risk, readers should conduct their own research when making a decision.
THE OPINIONS EXPRESSED BY THE AUTHOR ARE FOR INFORMATION PURPOSES ONLY AND DO NOT CONSTITUTE FINANCIAL, INVESTMENT OR OTHER ADVICE.
Graphic: tradingview.com






