
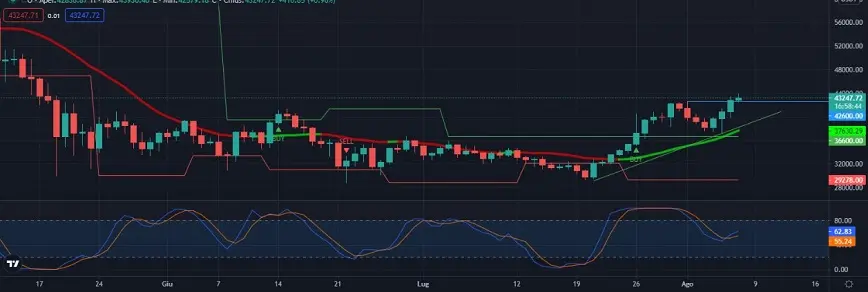
Bitcoin carried out the continuation we talked about yesterday, with a short break above 42,000 and a very high volume at the beginning of the weekend. I believe we can confirm a continuation of the growth that can last until the close of the week. The close on the 4-hour chart above 42500 confirms that 44500/45400 could be reached. In the short term, the stock could correct, but the important thing is that it remains above the ascending trend line. Support has now become 42600.
For intraday trading I am attaching today's levels for BTC BNB and ETH.
How to interpret these levels?
I use them like this, I use a time frame of 30 minutes and with a close of the candle above the BUY ABOVE price I go long with the relative targets. And the indicated stop loss. I consider the first three targets the most important ones.
A short opening occurs with a price below SELL BELOW with the relative targets and the stop loss.
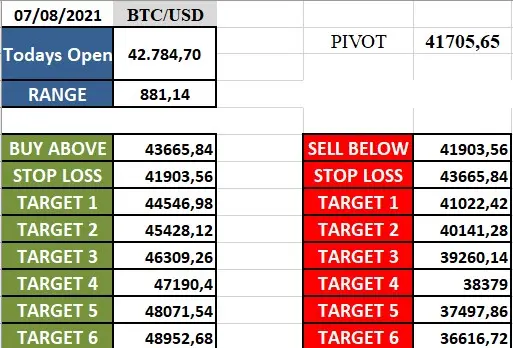
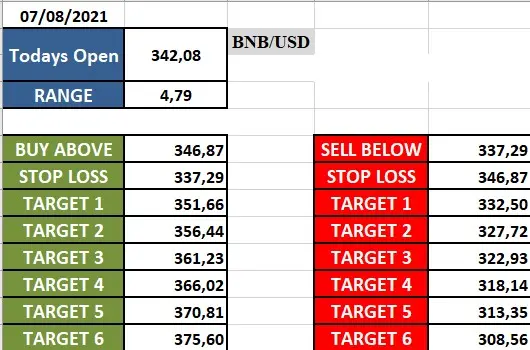
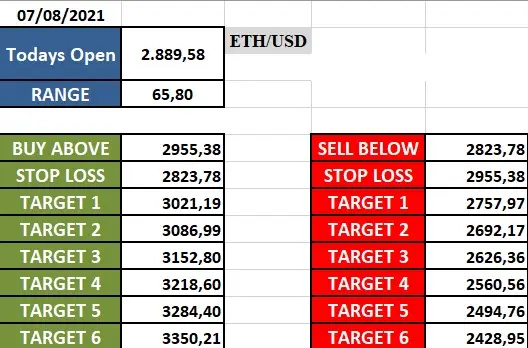
Chart from tradingview.com
Log in to Publish0x:
https://www.publish0x.com/?a=oQeZ4DR6bp
Register an account on Binance to get a 5% discount on commissions forever and other advantages that you will discover by contacting me [email protected] Enter Binance ID and I will log you into a dedicated telegram channel. https://www.binance.com/it/register?ref=NG0GOL6H
Follow me on Telegram for more details during the day, it's free and not just crypto, test my signals https://t.me/joinchat/_J8vQO5jNPBlYTg0
This article does not contain investment advice. Every investment and trading move carries a risk, readers should conduct their own research when making a decision.
THE OPINIONS EXPRESSED BY THE AUTHOR ARE FOR INFORMATION PURPOSES ONLY AND DO NOT CONSTITUTE FINANCIAL, INVESTMENT OR OTHERWISE ADVICE.
Thanks for reading






