
Image by Irina Pechkareva from Pixabay
A long time ago, a college professor told me that business and investing, in general, were simply about "beating the cycle." Every recession was going to be followed by a revival, which in turn was going to be followed by a recession, and so on. Every bull cycle is going to be followed by a bear cycle, which will be followed by a bull cycle, and this never ends. What you have to do is get ahead of the cycle and invest accordingly.
As if it were that easy!
As a chess player, I know well that anticipation plays a fundamental role in any game. Anticipation does not ensure victory, but it greatly facilitates it. With which, I made anticipation a life system. To the point that I came to think that there is a fundamental DNA in the markets, a "genome" of the markets. Genome is a term that refers to the genetic code of a living being. For this reason, my doctoral thesis (not yet defended) is called The Market Genome, and it basically consists of trying to assimilate the rigorous chaos of a fractal known as the Mandelbrot algorithm, to the functioning of some markets that take their shape from the free play of supply and demand. (Benoit Mandelbrot is considered the father of fractals).
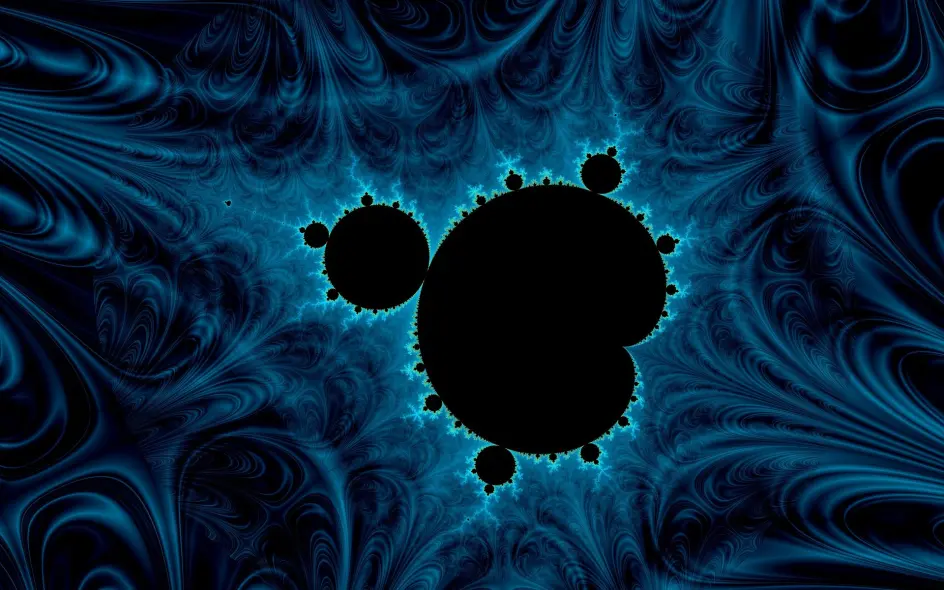
Mandelbrot set
Imagen by Charles Thonney from Pixabay
The Mandelbrot algorithm, also known as the "Devil's Polymer", is for many theorists the most complex set of mathematics. The fractal drawings’ that the computer makes from the Mandelbrot set, awakens in anyone a kind of paralyzing fascination. It is a sensation difficult to explain as if you were seeing the primordial algorithm of Creation. Mandelbrot began by iterating a simple algebraic expression on his computer in the early 1980s when the first personal computers were being developed. The result was like unearthing a diamond, although in this case, the diamond was an amazing mathematical "strange attractor." The propulsion system that drives the computer towards the Mandelbrot set is the term Z² + C, where Z is a complex number that can vary and C is a fixed complex number. Plugging these complex numbers into an equation tells the computer to take the result of the sum Z² + C and the next time (and the next time after that, and so on), and put it in Z's place. Millions of iterations result in the drawing I showed above. Some results of the equation are ejected to infinity and do not appear in the drawing. Other results are numbers that belong to the set and are therefore drawn as a colored point, depending on how far from infinity they are. In the end, that species of primordial beetle appears, which generates other identical beetles around it, coming from the interior of a very simple formula in the world of complex numbers. Benoit Mandelbrot called this phenomenon "self-similarity", which can also be seen in various beings in nature. The most impressive example is the broccoli flower.
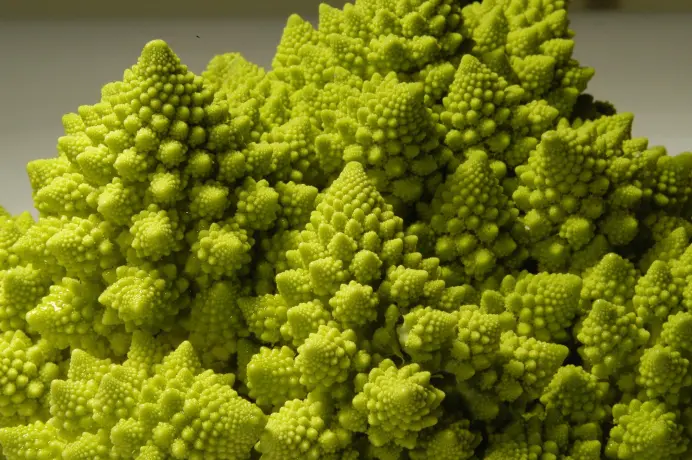
Imagen de Marco Pastorino en Pixabay
For you guys interested in playing around with the Mandelbrot algorithm, here's some code to do it.
Now, we all know that 90% (?!) of the projects that currently coexist in the crypto sphere are going to disappear irremediably. And that in the remaining 10% there are BTC, ETH, BNB, KCS, VET, ALGO, SOL, MATIC, ADA, and some others. With this, the chances of survival of new projects are extremely weak. The situation is similar to that of the “dot.com” fever of the late 20th century. Some survivors are Google, Facebook, YouTube, WhatsApp, Twitter, Instagram, Amazon, Telegram, PayPal, and several others. Imagine if a KuCoin existed at that time to show us possible gems like these! Really, once again, I think we are privileged to be participating live in this technological revolution.
It seems that the Mandelbrot formula generates pairs of numbers, but only a few survive, the ones left inside the beetle. The rest are ejected towards infinity.
Therefore, that anticipatory capacity that successful men and women have is closely related to the discovery of which project is going to survive, that is, a gem. It's like finding out which is the result of one of the iterations of the Mandelbrot algorithm that is going to fall into one of the beetles.
Let's quickly remember. A gem is a new project, with a low market capitalization, which, due to its intrinsic characteristics, has great growth potential in the short and medium term. It takes a special “clinical eye” to discover gems, but any ordinary person like me can still do an analysis based on common sense and some math, and think that I just stumbled across a gem.
KuCoin is by far the platform that has contributed the most gems to the crypto sphere. That is why it is important to be aware of the new KuCoin listings, which can be followed every day, on its Telegram channel, on Twitter, on the website's blog, or on the mobile application. In the latter, there is a “New Listings” button that provides instant information on the new projects listed.
KuCoin is widely known as the “People's exchange”, although it is designed for all types of investors, including the most sophisticated futures and derivatives traders. KuCoin is hands down the number 1 altcoin exchange, with over 700 assets and over 1,200 trading pairs. A number of successful projects (gems) such as BLOK, CHMB, VR, KMA, and DAO, were first listed on KuCoin. In KuCoin you can do Spot Trading, Margin Trading, P2P fiat Trading, Futures Trading, Staking, and Lending to 18 million users in 207 countries and regions around the world. According to CoinMarketCap and CoinGecko, KuCoin is in the top 5 among world exchanges.
The most recent and shocking news is that KuCoin has just received a $10 million strategic investment from Susquehanna International Group (SIG). SIG is a private trading and technology company. It was founded in 1987 by Jeff Yass, Gerald Yass, Arthur Dantchik, Steve Bloom, Eric Brooks, Andrew Frost, and Joel Greenberg, and handles millions of trades on exchanges around the world every day. In this way, by providing liquidity and guaranteeing competitive prices for buyers and sellers, SIG plays a fundamental role in the financial markets. That is why this strategic partnership is so important for KuCoin, especially to develop its KCS and KCC ecosystem, and to ensure the launch of new gems.
During the months of June and July 2022, there were several new listings at KuCoin. I am going to analyze below the REV3AL token, which I am going to follow very closely in the coming months. First I will describe the fundamentals and then some technical analysis.
By anticipating potential gems, KuCoin is solving two big problems.
First, it makes available to the people what was previously only restricted to bankers, corporations, VCs, and other capital hoarders. It is these operators of capitalism who "detect" potential gems and reserve them for themselves. You deposit money in a bank, and the bank uses your money among other things to buy shares in these gems, and it gives you peanuts in terms of interest. In the event that the gem grows a lot in price, all the profit is theirs. And they don't even send you a thank you letter to your house congratulating you for being such an asshole.
Second, KuCoin does much of what the ecosystem calls DYOR. This is the great service that KuCoin offers and that greatly differentiates it from other exchanges because it saves you a lot of work. It's not like a handsome guy or a stunning girl walks by the KuCoin offices, drops off their hot project, and KuCoin publishes it. In reality, KuCoin is in charge of analyzing a large part of the fundamentals, especially those referring to the strength of the company, the background of the developer team, the partners that the project has, who are the companies that have already invested in the project, the structure of the project's Tokenomics, the Roadmap proposed by the team for the coming times, and undertake the corresponding audits. When KuCoin lists a potential gem, all of this is already analyzed. Of course, this analysis in no way guarantees that the gem will become an excellent business because then come the macroeconomic issues and the functioning of the market that can never be predicted exactly, although it can be analyzed to achieve the long-awaited anticipation.
The point is to discover the pair of complex numbers that represent the project in question, which makes the project fall into one of Mandelbrot's beetles, and not be one of many that are ejected into infinity.
Whenever we are going to face an investment process, it is necessary to combine some fundamental analysis and some technical analysis. Business, like all human action, always has something of art and science at the same time. In short, the markets are the sum of each of the actions added by each intervening human being and tend to often become a self-fulfilling prophecy. Thanks to this phenomenon, the anticipation process is often greatly facilitated.
The eternal discussion of whether the fundamental analysis is better than technical or vice versa seems to make no sense. Both are complementary. And especially, both are necessary to analyze a gem. Because, precisely, the gem has a very short life so far and a very little history. This would seem to suggest that only fundamental analysis is necessary. But this is not true, because depending on how it "starts" in the first weeks in the market, technical analysis can show a lot of information regarding the future performance of the gem.
Fundamental analysis shows the "real" or "potential" value of the gem, which is known as intrinsic value and reflects something like the real price of the gem from its operating assumptions, the market environment and its competitors, and growth expectations. Its usefulness lies in being able to simulate with these assumptions an expected flow of funds that can be discounted at an interest rate to obtain a net present value of the gem.
For its part, technical analysis is often used to show graphs of price series over time, developing indicators that can serve as a warning to leave a position (stop loss) or to take a position in the gem. Chart analysis can be applied to any price frequency chart at any time and can help build buying and selling strategies. The process should be able to serve as a trigger so that everyone interested in the gems that KuCoin lists as new listings every month, can face a deeper analysis.
For the fundamental analysis, I am going to analyze what the gem is for, in this case, REV3AL, what is the problem that it tries to solve, what makes it unique, and who are the main competitors. Let's remember that infrastructure issues such as the developer team, strategic partners, Roadmap, and Tokenomics, I consider analyzed already by KuCoin before listing. (if you are not testing a recently KuCoin listed gem, you will need to do this test as well).
For technical analysis, we are going to consider 4 indicators: MAC, MACD, RSI, and BOLL. Unfortunately, we cannot elaborate much on the meaning, the mathematical basis, and the different parameters that the indicators have, otherwise the post would be very long. It is enough to know that the KuCoin platform allows the analysis points and parameters of each indicator to be widely varied so that each case can be analyzed with the necessary depth.
Here we go.
REV3AL
1) Fundamental Analysis.
Having understood that the NFT market is going to be one of the great protagonists of the web3 crypto economy in the coming years, I have always been concerned about the number of counterfeiting and malicious copying crimes that this ecosystem generates. I myself have been a collector of NFTs for several years and also created my own collection with a monster that I drew for the first time when I was 13 years old, which was recently whitelisted. If you want to see it, here it is. I always felt intimidated because a simple screenshot with a smartphone can be used to pass off an NFT that does not belong to us as our own.
REV3AL is presented as a solution to stop the counterfeiting of NFTs. That's why I find it very attractive. There are already solutions proposed for this problem, but within other platforms. REV3AL is dedicated solely to solving the problem of counterfeiting.
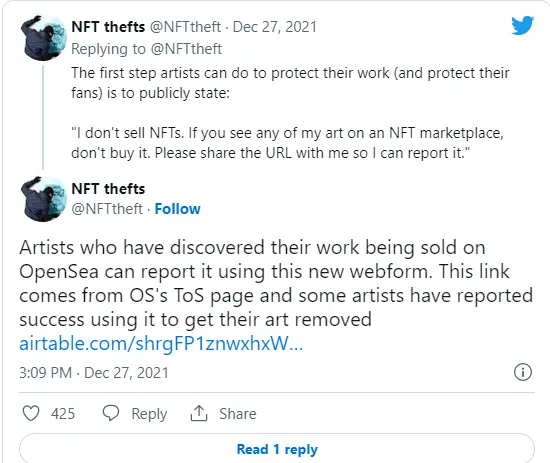
Recently, a Twitter account, @NFTtheft, dedicated to the care and protection of copyright on NFTs, announced that various artists have noticed that many of the NFTs offered, belonging to OpenSea, are replicas or plagiarism.
Scams occur in multiple ways. From impersonating an artist, phishing featured artists and unregistered copies on blockchains. There is also money laundering, as illegal market manipulation that inflates volume and price to favor buyers and sellers. The problem is based on the still very weak infrastructure of the market that facilitates the actions of hackers and scammers. NFTs are used to raise money for dodgy projects that end in dismal failures or a sudden "rug pull" where anonymous founders take everyone's money.
This is where the utility of REV3AL comes in.
OpenSea implemented an SOS button, which allows users to lock their own account if they suspect it has been compromised. Other platforms are trying to mitigate the problem with similar solutions. However, there is no project entirely dedicated to the early detection of NFT counterfeiting and fraud like REV3AL. Artists are the weakest link in this chain and are severely damaged by these criminals.
REV3AL offers digital copyright protection and anti-counterfeiting solutions for artists, creators, and intellectual property owners. With its anti-counterfeiting and multi-layer authentication protocol, REV3AL hopes to play an important role in protecting digital media, on platforms such as NFT marketplaces, gaming platforms, and the Metaverse.
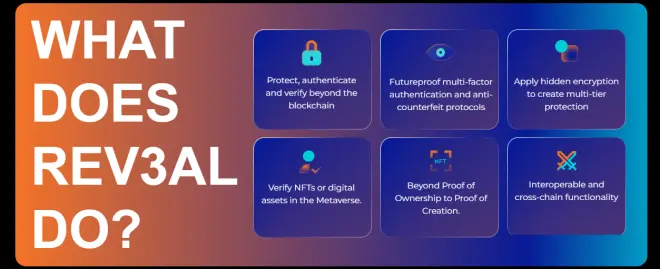
Source: https://rev3al.io/
There is currently no such complete solution to the counterfeiting problem as REV3AL's, and it appears that it can maintain this competitive advantage, given its proprietary technology. The operation of REV3AL could be assimilated to that of VeChainThor and its VET token, although the latter is more related to the logistics process of a product, being where a large part of the counterfeits take place.
REV3AL has received wide support, with a strong organic following on Twitter and Telegram and the project aims to establish itself in the ecosystem as an industry standard for asset media authentication.
The Global Non-Fungible Tokens (NFTs) Market is expected to reach a value of USD 122.43 Billion by 2028, at a CAGR (Compound Annual Growth Rate) of 34.10% over the forecast period (2022 - 2028). The number is fabulous. With only minimal adoption in the NFT business, REV3AL promises a terrific business.
2) Technical Analysis.
The REV3AL token is called REV3L.
KuCoin listed the REV3L token on Jun/30/2022
First of all, we see some data taken from CoinMarketcCap:
The REV3AL address on Binance Smart Chain (BEP20) is: 0x4ffa6bb42d1a1a6d8e79935ccf1457d55decff3f
The current price (Jul/26) is $0.008966, and the change in 24 hours is -4.86%.
The trade volume in 24 hours is $77,030.88 and its market Rank is #4011.
There is no data for the Market Cap, which is a fundamental measure for gems. But it seems that there is not because the number of tokens in circulation is not known for sure. In any case, let us think that a very small Market Cap is considered when it is less than $100 million. The Fully Diluted Market Cap (total supply x price) is $8,965,623.01, so REV3L’s is a really low Market Cap. And this is the good news. If the fundamentals and the Roadmap are fulfilled, we are facing a true gem.
The Total Supply is 1,000,000,000 REV3L.
The All-Time High is $0.0212 on Jun/30/2022
The All-Time Low is $0.007992 on Jul/04/2022
Now let's look at a series of indicators on some charts taken directly from the KuCoin trading platform.
For that we go to Trade > Spot Trading and look for the REV3L/USDT pair. We click there and the general chart appears showing the price series with respect to time.
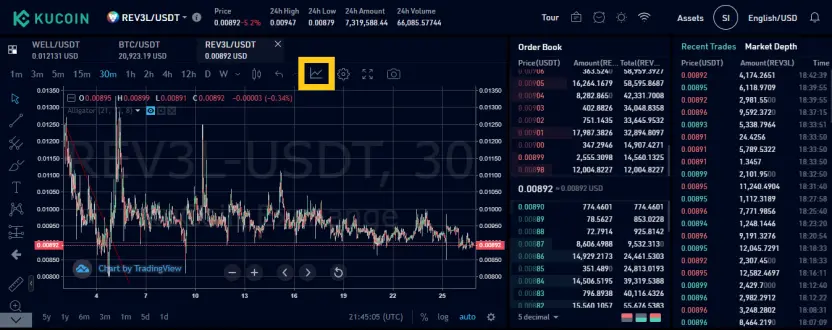
We see the typical look of a gem after a few weeks of its release. A high price for one or two days, and a sharp drop that tends to stabilize, well below its ATH.
We are going to click on the “Indicators” icon marked in yellow in the previous chart. Next, a series of indicator categories appear. By clicking on each of them, you can choose the indicator with which you want to analyze the trade of your REV3L/USDT pair.
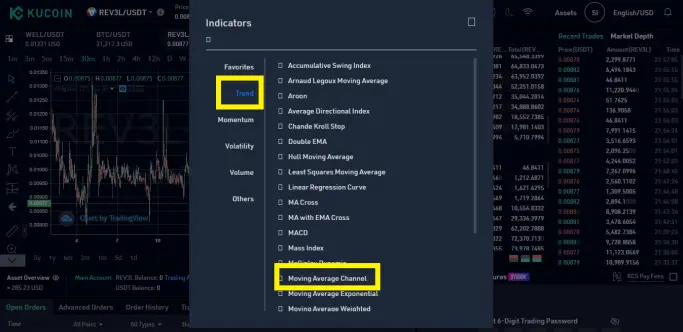
The categories are Favorites, Trend, Momentum, Volatility, Volume, and Others.
The indicators I chose respond only to my preferences in the analysis. As you can see, there is a large number of indicators in KuCoin with which to do all kinds of cross analyses.
First Indicator: We choose the Trend category and there MAC.
Indicators > Trend > Moving Average Channel (MAC). We click there.
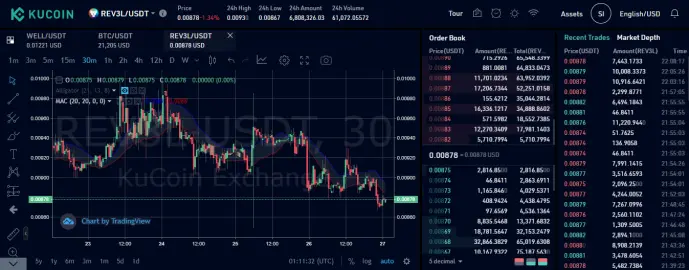
Automatically two lines appear, one blue above the candles and one red below, which make up the channel. I made the “x” axis of time shorter to be able to appreciate the channel well. The MAC is based on moving averages of highs and lows. The MAC uses two MAs, one of the high price (blue) and one of the low prices (red). Note that when prices break out of the channel, they tend to return. Evidently, the channel is a "strange attractor" in fractal language. On the 26th the prices went down from the channel and are returning. It's arbitration time. MAC offers a specific method for determining the initial stop-loss for trade once there has been a setup and a trigger. The channel tells us where to apply the stop-loss. Moving averages are favored tools of traders to measure momentum.
Second Indicator: We choose the Momentum category and there we select RSI.
Indicators > Momentum > Relative Strength Index (RSI). We click there.
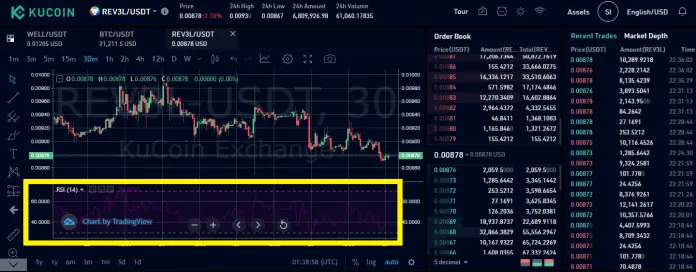
Note the appearance of a purple curve at the bottom of the graph. RSI is an indicator that ranges between zero and one and measures the speed and magnitude of a token's recent price changes to evaluate overvalued or undervalued conditions in the price of that token. RSI can signal when to buy and sell. Traditionally, an RSI reading of 70 or above indicates an overbought situation. A reading of 30 or below indicates an oversold condition. The condition that this chart shows us for REV3L is a pronounced undervaluation for day 27. It is logical to expect its price to increase in the next few hours.
Third Indicator: We choose the Volatility category and there we select Bollinger Bands®.
Indicators > Volatility > Bollinger Bands® (BOLL). We click there.
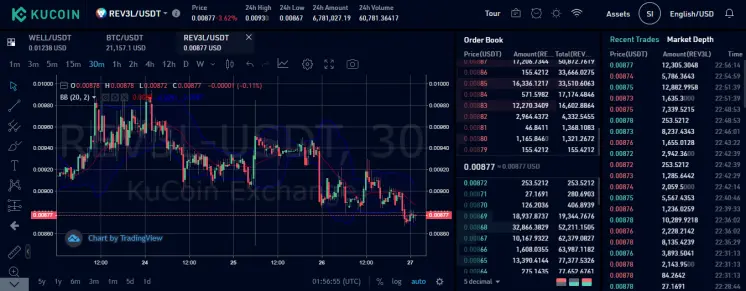
Now we see the appearance of three lines, two blue above and below and one red in the center. The blue bands are the Bollinger® bands, and the central red line is the moving average. The closer the prices move to the upper band, the more overbought the market is, and the closer the prices move to the lower band, the more oversold the market is. When the bands come close together, constricting the moving average, it is called a squeeze. A squeeze signals a period of low volatility. The bands give no indication when the change may take place or in which direction the price could move. Approximately 90% of price action occurs between the two bands. Any breakout above or below the bands is not a trading signal.
We see that the bands for REV3L are very far apart at the moment, which means that we are in the presence of high volatility and good arbitrage opportunities, knowing that it is highly probable that the prices vary within the bands.
Fourth Indicator: We choose the Trend category and there we select Moving Average Convergence Divergence (MACD).
Indicators > Trend > Moving Average Convergence Divergence (MACD). We click there.
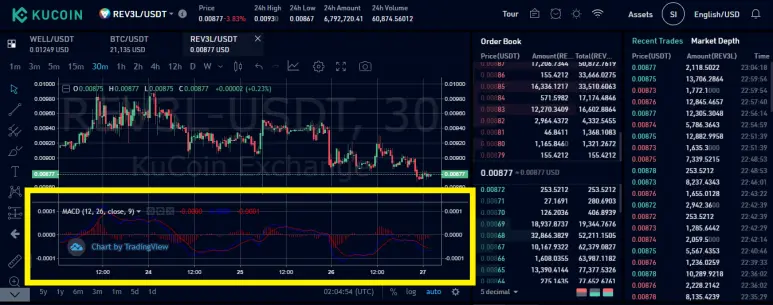
Here we see the appearance of two lines, one blue and one red. A histogram plotted with red sticks also appears.
MACD shows the relationship that exists between two moving averages. It is calculated by subtracting the 26-period EMA from the 12-period EMA. The result of this operation is the blue line shown in the graph above. A line called the “signal line” (in red on the chart) is then calculated as the 9-day EMA. This red line can work as a trigger for buy and sell signals. When the MACD crosses above the signal line, you should buy, and when the MACD crosses below the signal line, you should sell. The histogram shows the distance between the MACD and its signal line. If the MACD is above the signal line, the histogram will be above the MACD's baseline. If the MACD is below its signal line, the histogram will be below the MACD's baseline. The MACD's histogram could identify when bullish or bearish momentum is high.
Our chart for REV3L shows us that this would be a time to sell our position, even though a signal line crossover appears to be approaching.
Conclusion.
The question is whether REV3AL will be one of the points that fall into or out of the Mandelbrot algorithm. And that is something that only time can tell. We can only approximate our forecasts by making the corresponding DYOR.
Doing the technical analysis of a gem is somewhat difficult because the indicators are more powerful the more price history a token has in the market. In any case, the criteria for investing in a gem are not the same as that considered for a token that is bought to hodle. Due to its high volatility and low volumes of operation, an increase of 100% in the traded volume, which is quite feasible, can greatly modify the price.
In addition, many times, crossing all the indicators, we can obtain contradictory results. That is when the artistic ability of the trader appears. His/her decision will be influenced by mathematics, intuition, and market sentiment. In our case, considering the four indicators that I used, the MAC tells us that we should buy, the RSI also tells us that it is a good time to buy, the BOLL tells us that the volatility is high and then we should be very sure to buy, and MACD tells us that we should sell.
What to do?
Mandelbrot, help us.
The important thing is that you see that KuCoin offers you a complete arsenal of tools so that you can make good investments based on mathematical analysis. Imagine all the calculations you had to do before there were computerized trading platforms!
Since the Egyptians, humanity has based much of its cultural evolution on discovering buried gems, which were available to anyone who worked to discover them. The process is similar to the one Mandelbrot discovered by running his algorithm and unearthing a world that always existed, but remained hidden because no one had used mathematics and computation to find it. The decentralization that began ten years ago is arming us with new tools every day. KuCoin processed several of those tools to make them available to gem hunters, until making an undisputed name in that field, which no one can ever take away from it.
The gems are buried out there, let's uncover them!
If you still don't have a KuCoin account, please consider doing it with my referral link here: rJE8S2S
Thank you for reading! Decentralize yourselves as much as you can, and much more! Work for yourselves, not for others. When you work for someone else, they pay you what YOUR POSITION is worth, when you work for yourself, they pay you what YOU are worth. No one achieves financial independence by working as an employee. Live long and prosper!
As usual, none of the things written in this post are financial advice and are not intended to replace personal research. My sole intention in writing this post is informative. Several of the things discussed here could be wrong, so in no way can this post be construed as financial advice, and in no way should it replace your own research.
If you have any questions or comments, please feel free to leave them down below
You can also contact me at [email protected]
Twitter https://twitter.com/SirGerardThe1st
LinkedIn https://www.linkedin.com/in/gerardosaporosi/
Follow my blog Anarchy: the Final Solution: https://gerardosaporosi.substack.com/






