
Before I start explaining why I began with support and resistance I want to clarify that this by far isn’t professional advice. This is the view of a beginning day trader that learns more by the day.
The first thing I learned in trading was how to read candles and candle patterns. this helps identify the trend and trend switches. However the most profitable indicator to me is identifying support and resistance and anticipating on these findings so I’m starting with S/R.
Using this simple method you can identify where allot of people either sell, or buy coins. And more importantly, join in!
Support and resistance levels are identified on a chart by drawing horizontal lines where the price will stop and reverse, acting like a ceiling or floor.
A support is the floor. Here investors enter the market driving prices up. This line is identified if the price reaches this level multiple times before reversing in an uptrend.
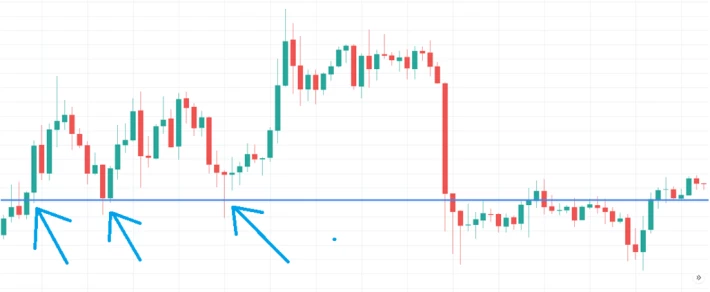
You can draw a support or resistance line by connecting the bodies or the wicks.
In this example the support is tested twice before breaking. Giving you three potential entries into the market.
To identify where to exit the market we have to search for the ceiling. This is identified in the same way as the floor.
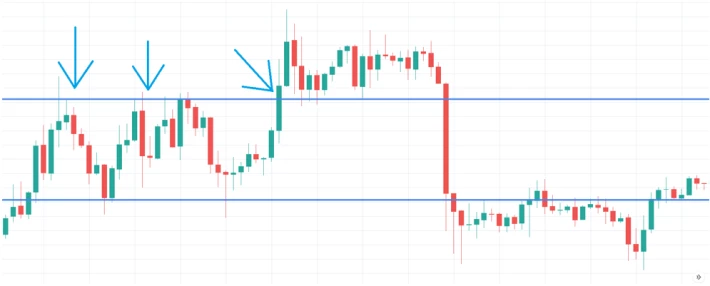
this gives rise to three possible exit points. In this example this would lead to 4% gains each cycle.
A support or resistance line is often a box rather than a line. Wicks dip into the box and get pushed back up (or down). This visualizes the buying or selling zone.
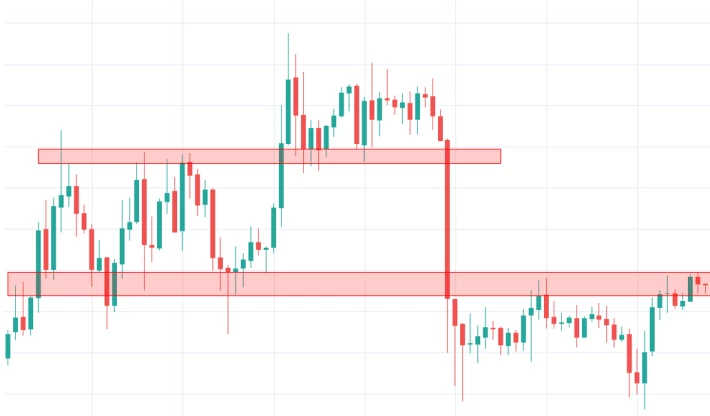
If using S/R as a day trading method, the following are things you need to keep in mind as well.
Passed resistance becomes support. And passed support becomes resistance. This is shown in the picture as well before breaking to the downside.
A candle needs to close below the drawn support or above the drawn resistance for it to be considered broken.
The higher the timeframe, the more strength every indicator has, this is no different with S/R. Start high when plotting. I go from Daily to 1 hour finishing at 15 minutes.
ALWAYS use a stop loss a few below your drawn support line.
Thanks for reading, and keep funds safu






