
A clear guide to understanding trend, momentum, and volatility tools—without the noise.
When I first started looking at charts, I assumed there had to be a trick. Something hidden in those lines and curves that could tell me—objectively—when to buy or sell. The more I looked into it, the more I realized that technical indicators aren’t magic formulas. They’re just tools—lenses to help make sense of price behavior.
Let’s look more closely at what these popular tools actually do, what they don’t do, and how you might use them more effectively—without getting lost in the weeds.
Types of Indicators and What They Do
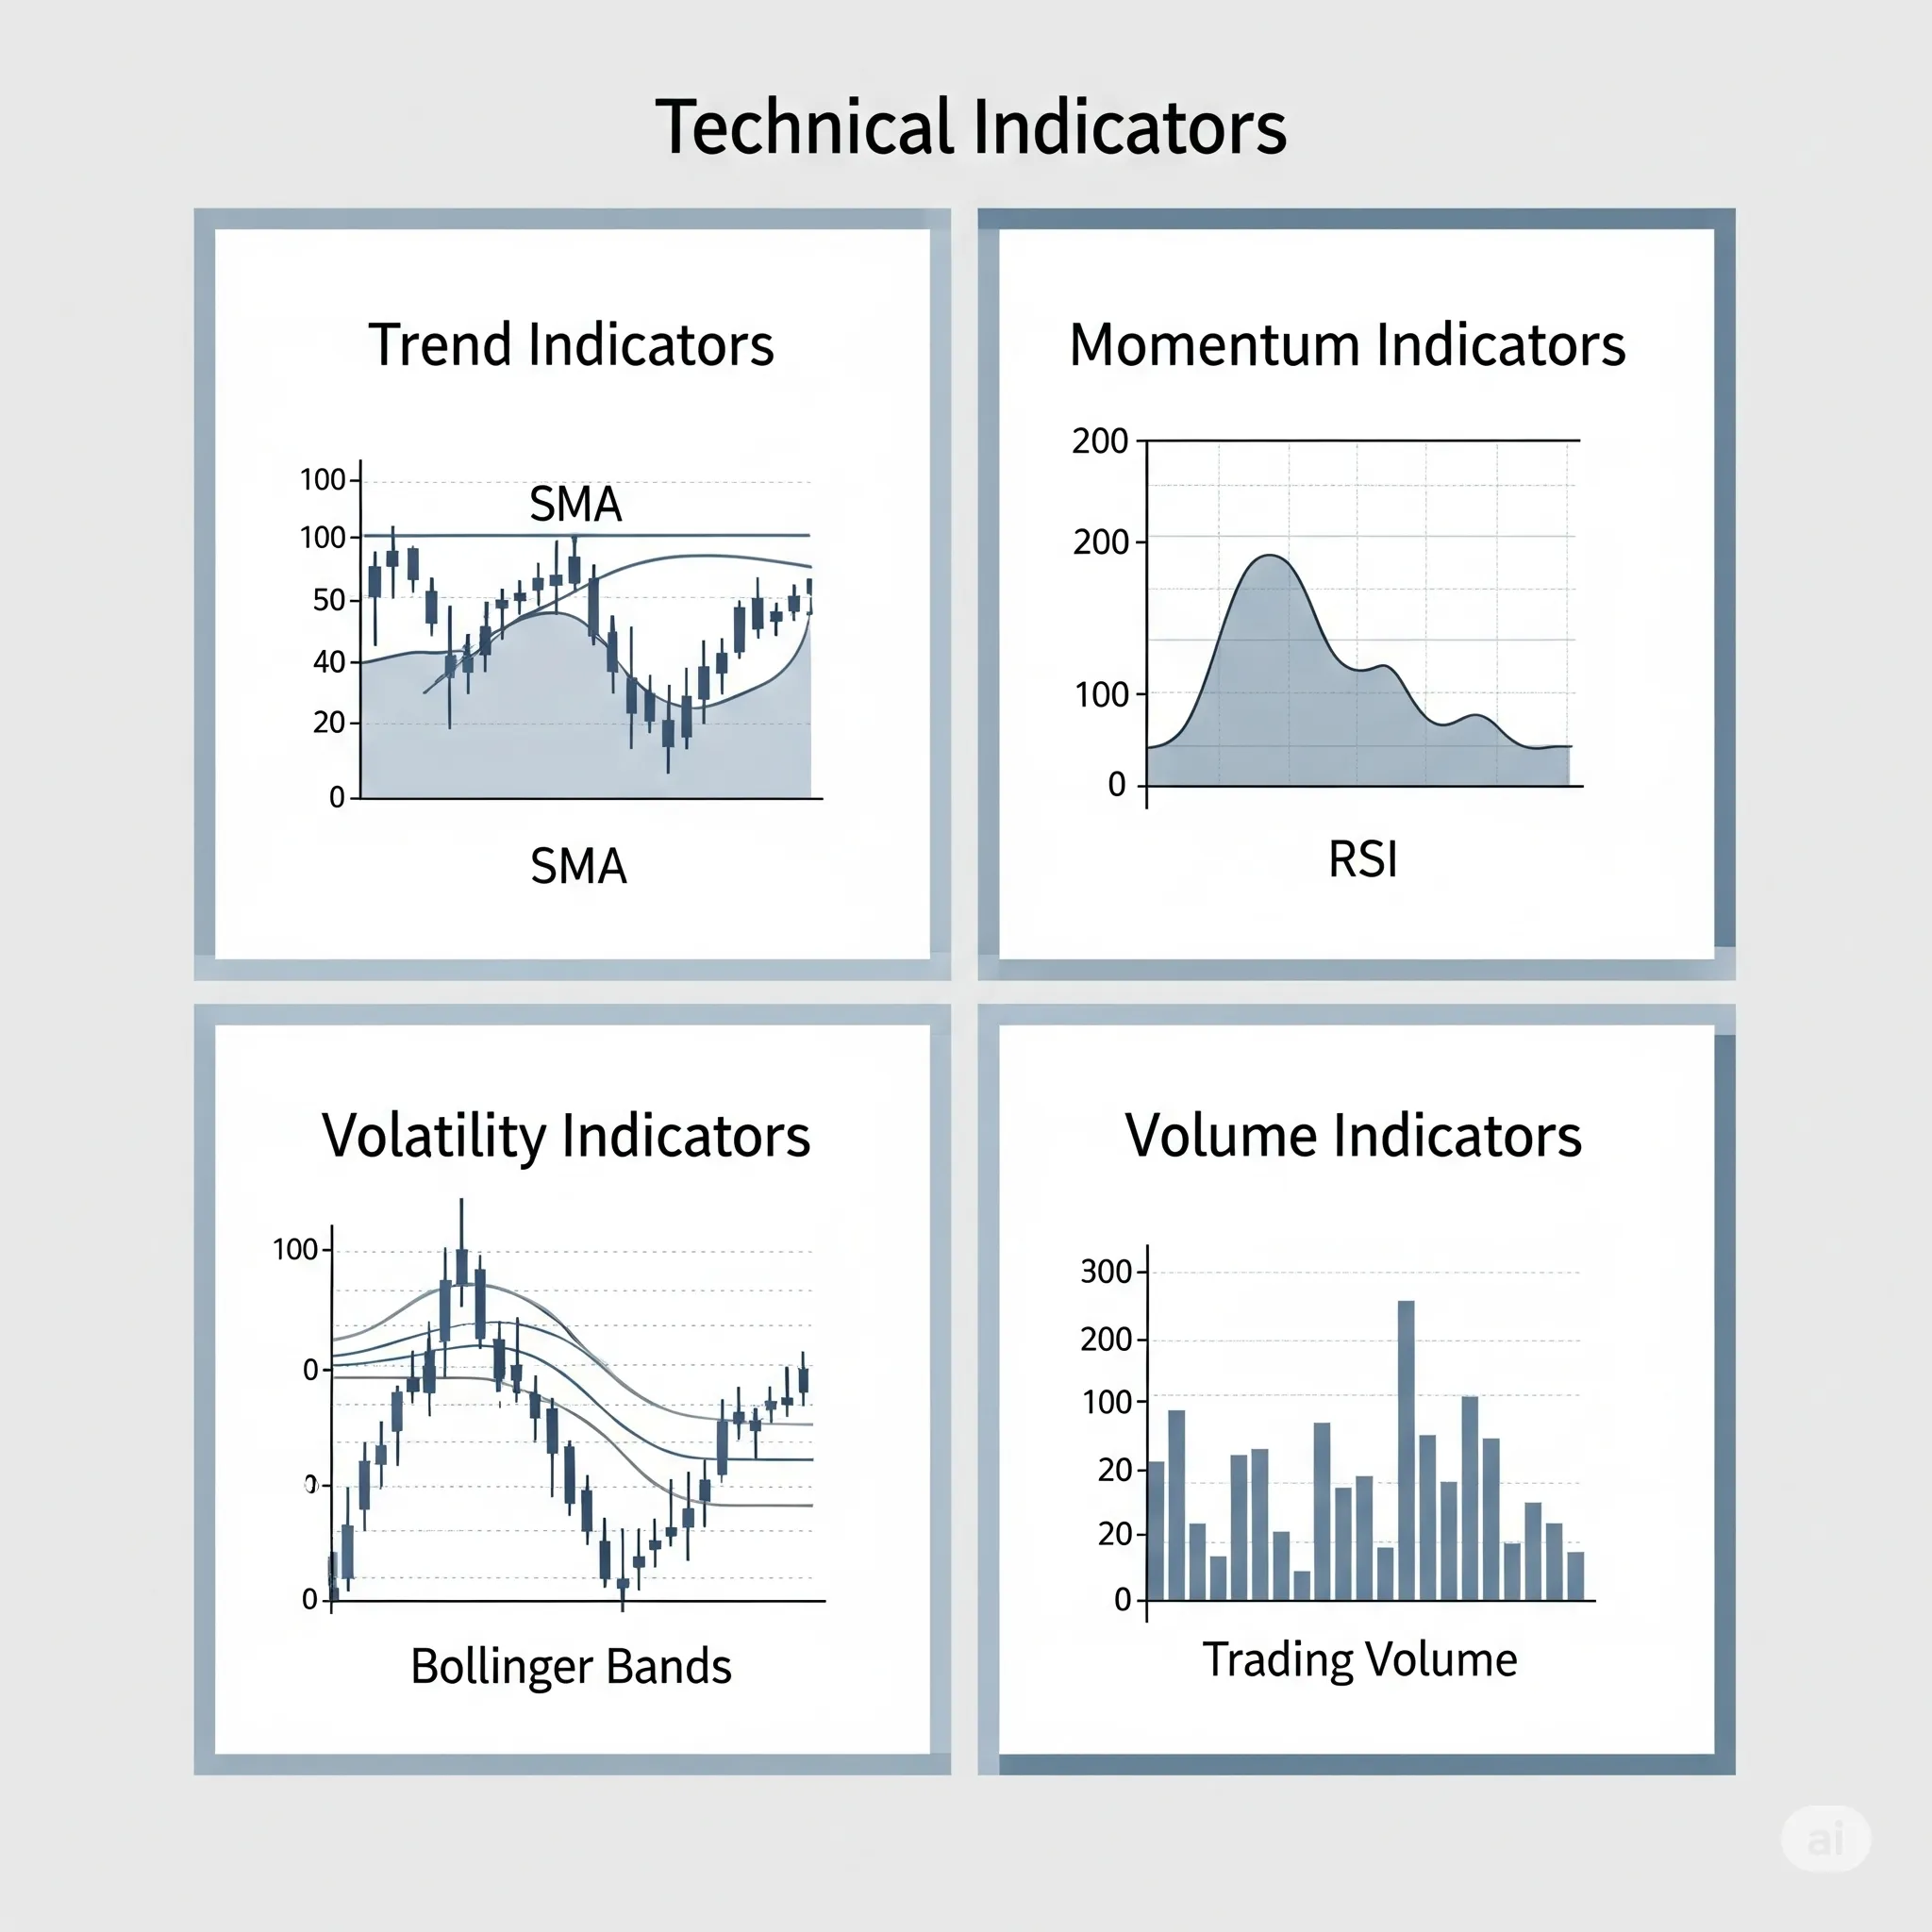
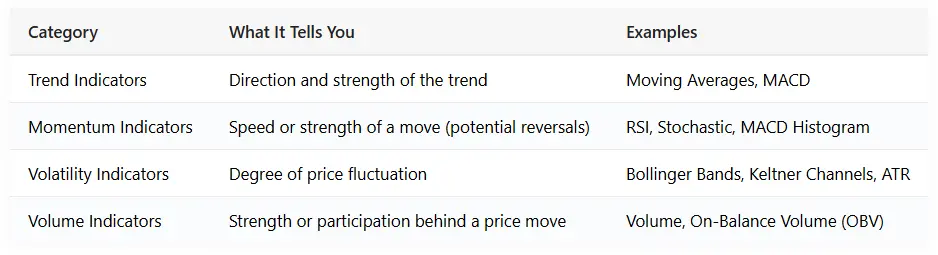
Before diving into specific tools, it helps to understand the four major categories of technical indicators. Each category serves a different purpose, and understanding them can help you avoid using redundant tools—or worse, misinterpreting what a chart is actually saying.
Moving Averages: Trendspotting, Not Fortune-Telling
A moving average shows the average closing price over a certain number of days. It’s designed to smooth out noise and help you spot the general trend. Category: Trend Indicator
-
Simple Moving Average (SMA): A basic average.
-
Exponential Moving Average (EMA): Reacts more quickly to recent price moves.
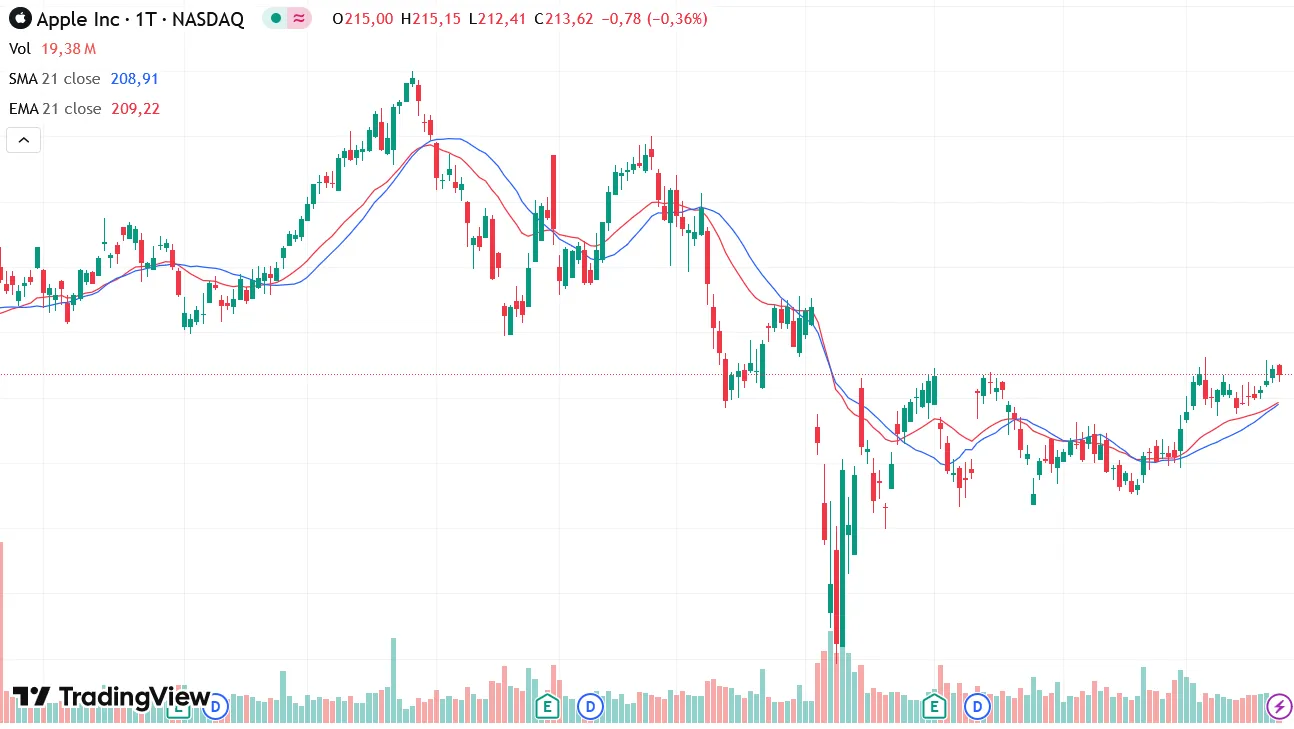
When price is above the 200-day average, it’s often seen as a long-term uptrend. But here’s the catch: moving averages are lagging—they confirm a trend after it has started. They don't forecast anything.
Example: In 2023, the S&P 500 broke above its 200-day moving average months after the market had already begun recovering[^1].
Relative Strength Index (RSI): Momentum in Context
The RSI helps measure how quickly price has moved. It ranges from 0 to 100. Traditionally: Category: Momentum Indicator
-
Over 70 = overbought
-
Below 30 = oversold
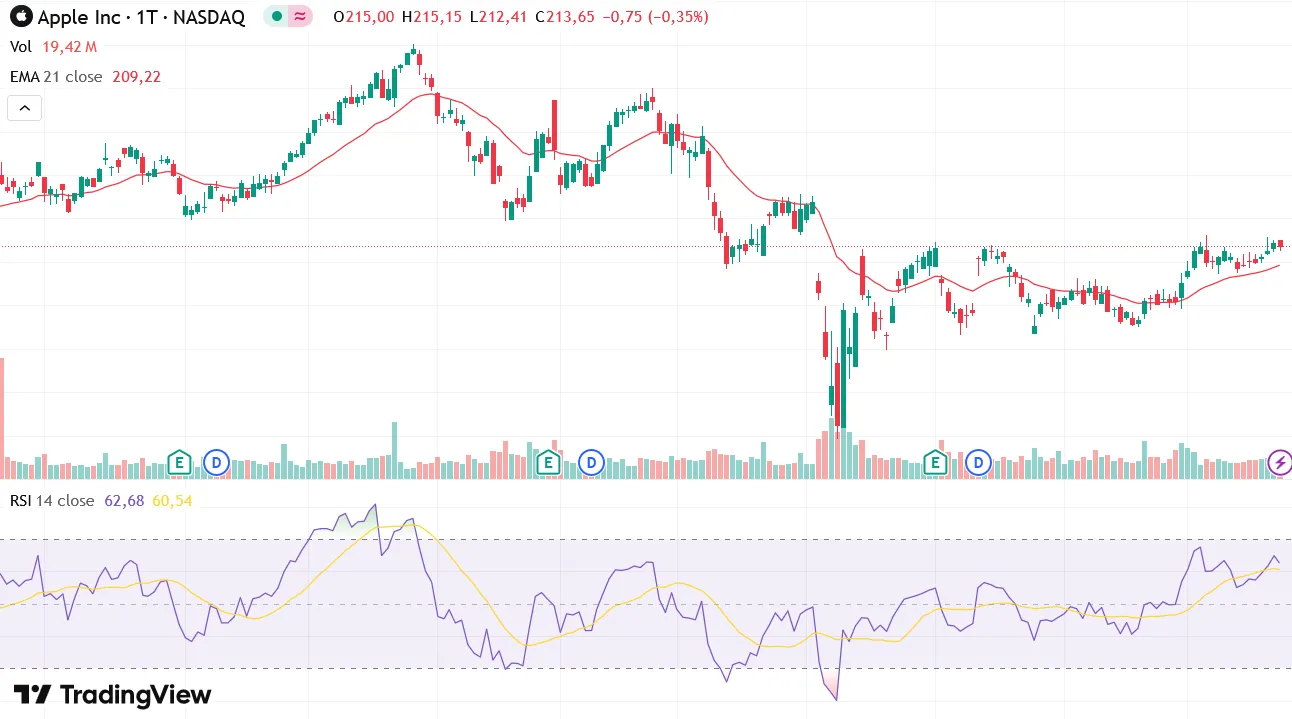
But that doesn’t mean the price has to reverse. RSI reflects momentum, not value. In strong trends, prices can remain overbought or oversold for extended periods.
Case Study: Bitcoin in late 2020 remained “overbought” by RSI standards for weeks—yet it kept rising[^2].
MACD: Confirming the Trend
MACD compares two EMAs (12-day and 26-day), plotting the difference and a signal line.
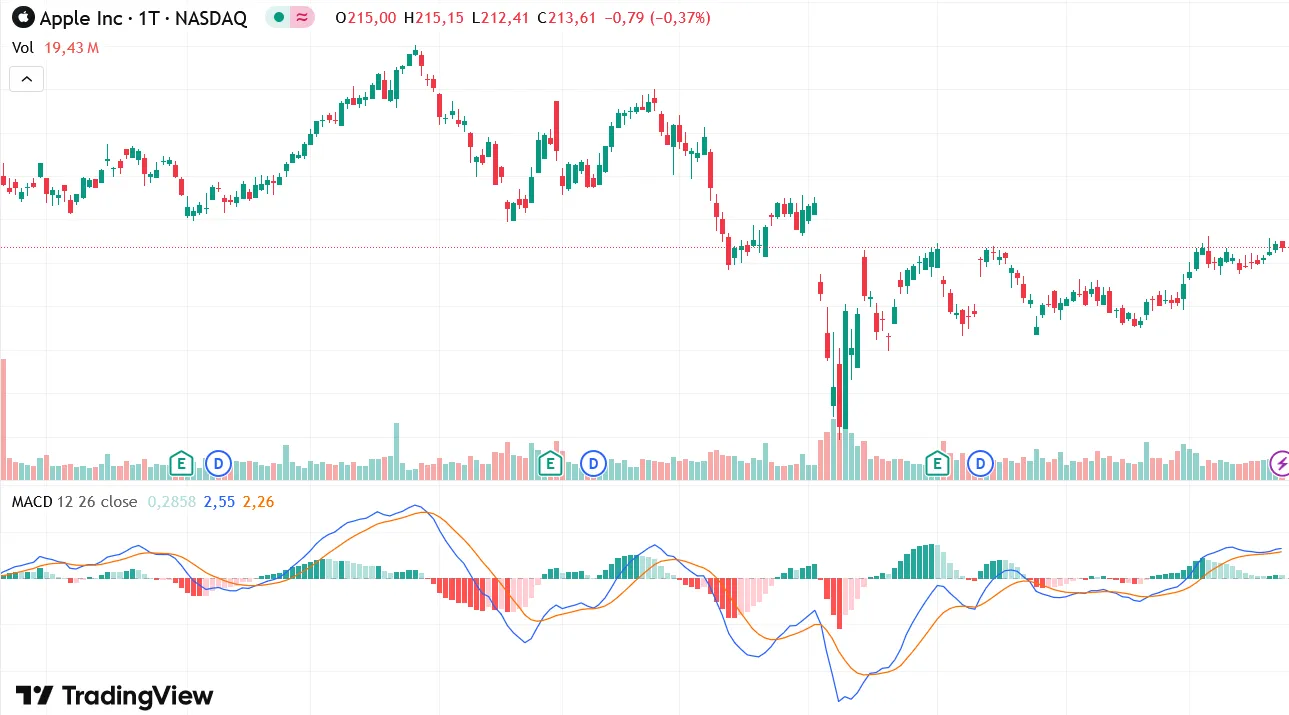
Crossovers can show momentum shifts. Category: Trend + Momentum Indicator
Like other indicators, MACD works better as confirmation, not as a standalone entry system.
Example: A bullish crossover might confirm a trend—but if volume is low or RSI diverges, it could be a false signal[^3].
Bollinger Bands: Visualizing Volatility
Bollinger Bands wrap a moving average with upper and lower bands based on standard deviation. They stretch when volatility increases, and tighten when price calms down. Category: Volatility Indicator
Many traders look for:
-
A squeeze (tight bands) before a breakout
-
Price touching a band as a sign of exhaustion
But these need context. Touching the upper band doesn’t mean “sell”—especially in strong uptrends.
Keltner Channels vs Bollinger Bands: Not Just Cosmetic
Keltner Channels are built around a moving average plus/minus the Average True Range (ATR)—a smoother measure of volatility. Category: Volatility Indicator
Unlike Bollinger Bands, they don’t react as dramatically to price spikes.
-
Bollinger Bands respond sharply to sudden volatility.
-
Keltner Channels are steadier, making them useful in identifying sustained moves.
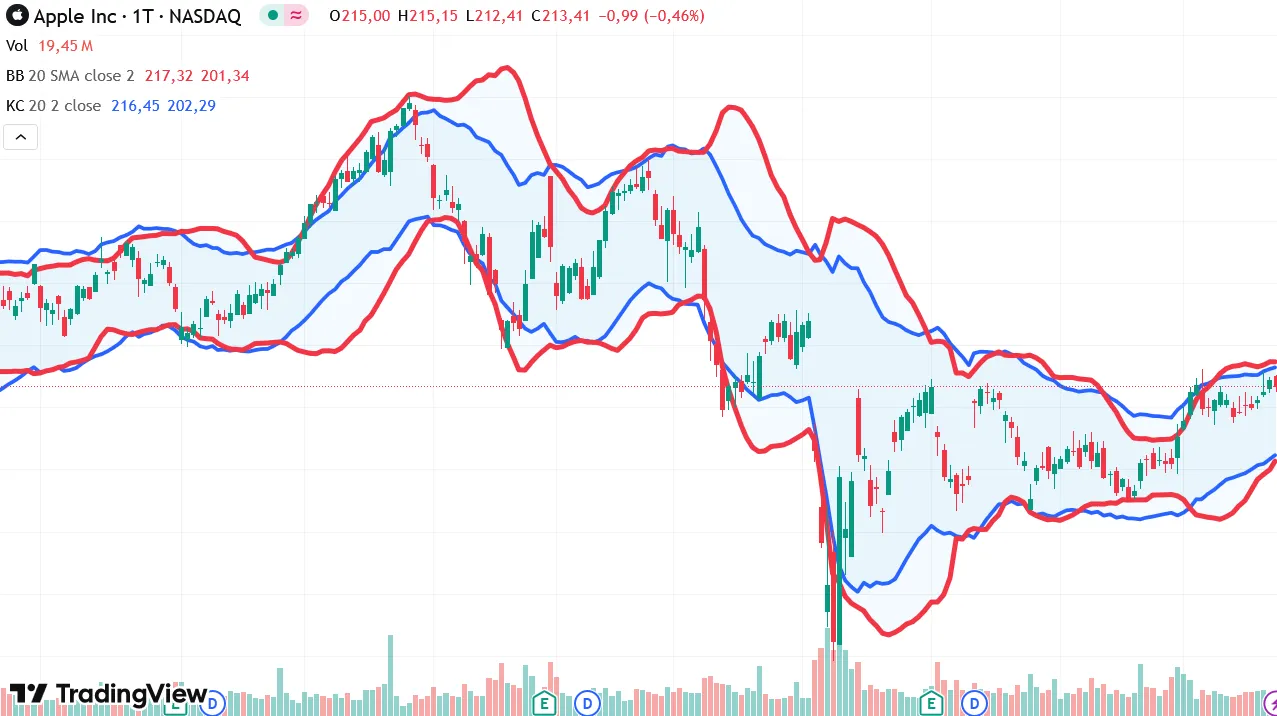
Pro Tip: Some traders watch for when price breaks out of both Keltner Channels and Bollinger Bands simultaneously—a sign of unusually strong momentum[^4].
Volume: The Crowd’s Voice
Volume tracks how many shares (or contracts) are traded. High volume during a breakout signals broader participation—more conviction. Category: Volume-Based Indicator
Example: A breakout from a trading range on low volume is suspect. But if the breakout comes with volume well above average, it’s more likely to stick[^5].
How to Choose the Right Indicators
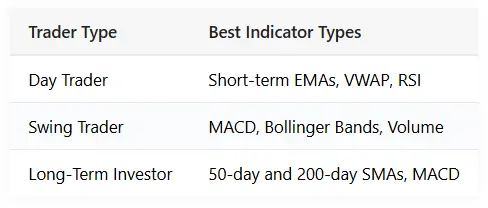
A surprising truth: most professional traders don’t use 10 indicators—they use two or three that match their style.
What Happens When Indicators Disagree?
Sometimes MACD says “buy” while RSI says “overbought.” It happens.
Here’s a simple rule of thumb:
-
In a strong trend, trust trend indicators (e.g., price above the 50-day average).
-
In choppy or sideways markets, momentum tools like RSI or stochastic oscillators may be more helpful.
When in doubt, don’t force a trade. Conflicting signals are often a cue to step back.
The Psychology Behind Indicators
It’s tempting to think the “right” indicator will eliminate risk. But no tool can do that. Indicators can support good decisions—but they can also encourage over-analysis.
Many new traders change indicator settings constantly, hoping to find the “perfect” setup. That’s often just hindsight bias in disguise.
The real edge comes from understanding your tools, sticking to a plan, and managing risk—not from tweaking parameters every week.
A Minimalist Setup That Works
If you want to keep things simple:
-
Use a 20-day EMA to follow the trend.
-
Add RSI to monitor momentum.
-
Watch volume on breakouts or reversals.
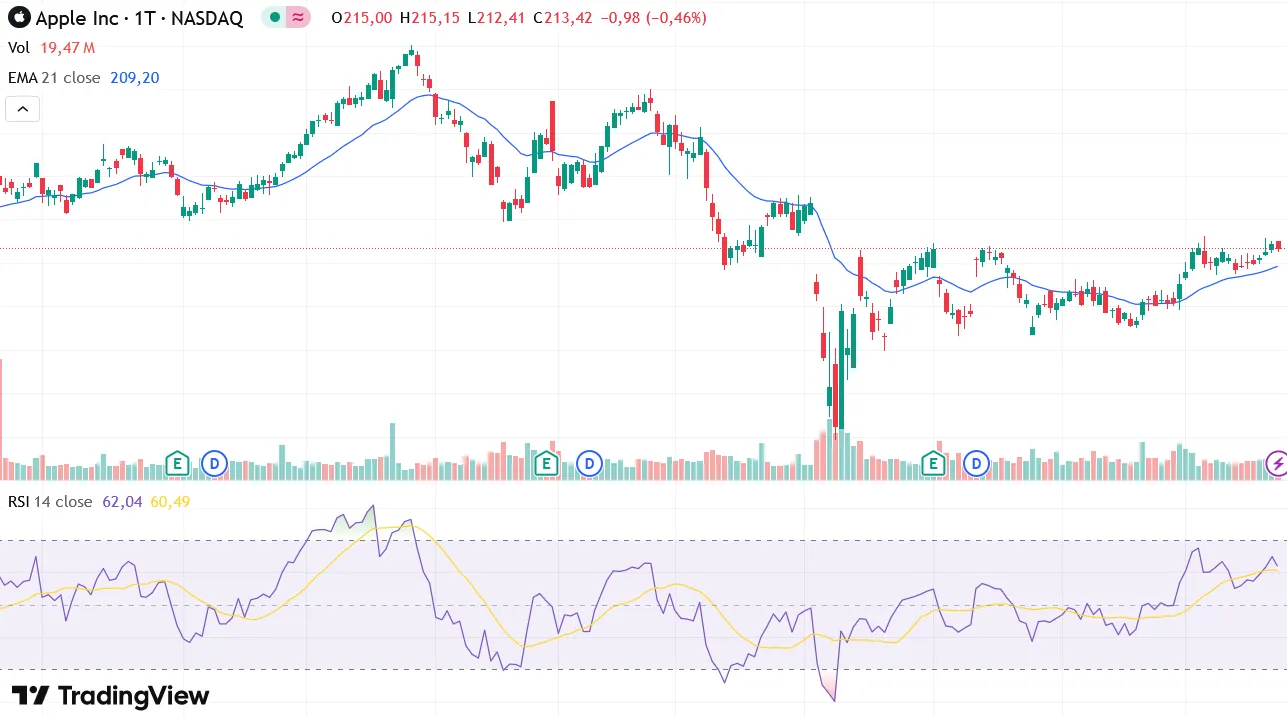
This basic combo works across stocks, crypto, and even forex—with slight adjustments for time frames.
Final Thought
Technical indicators won’t tell you what’s about to happen. But they can help you see the market more clearly—and that’s no small thing. Used well, they’re not prediction tools. They’re just better questions you can ask of the price.
References
-
CNBC Markets. (2023). “S&P 500 Reclaims 200-Day Moving Average.”
-
CoinDesk. (2020). “Bitcoin’s RSI Stays High—What It Means.”
-
Investopedia. “MACD: What It Is and How to Use It.”
-
Bollinger, J. (2001). Bollinger on Bollinger Bands. McGraw-Hill.
-
O’Neil, W.J. (2009). How to Make Money in Stocks. McGraw-Hill.




