

BTC is once again trading near the $110,000 mark, gaining nearly 4.5% over the past seven days. For four consecutive days, the price has held above $105,000, further reinforcing bullish sentiment in the market.
At the same time, major players have paused accumulation, while technical analysis points to solid support: EMAs are aligned bullishly, and the Ichimoku Cloud is providing a safety net from below. As BTC pushes through key resistance levels, traders are trying to determine whether the market has enough strength for a breakout or is gearing up for a correction.
Whales slow down accumulation
From May 28 to June 4, the number of whales holding between 1,000 and 10,000 BTC rose from 2,002 to 2,017 — often seen as a signal of renewed interest from so-called "smart money." But the growth has since stalled: over the past week, the number has fluctuated between 2,013 and 2,016 addresses, currently sitting at 2,013.
This suggests that the phase of active buying has paused, at least for now.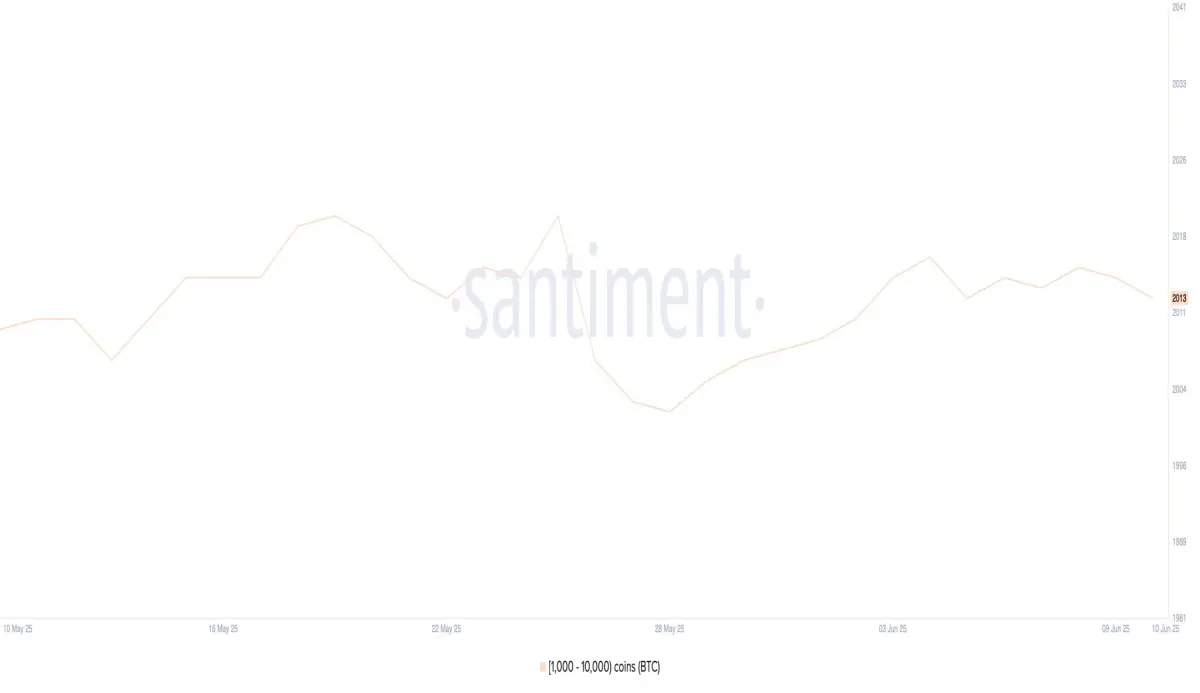
Number of Bitcoin whales. Source: Santiment
Tracking whale activity is crucial, as their movements often precede major price shifts. These holders have the power to influence market sentiment, trigger liquidity waves, and signal institutional confidence or caution.
The current pause in activity could indicate a wait-and-see approach amid macroeconomic uncertainty or mixed technical signals.
Bitcoin stays above the cloud, but momentum is fading
The chart shows that BTC’s price continues to move above the green Ichimoku Cloud, confirming the market’s bullish structure.
The upper boundary of the cloud (Leading Span A) is rising, and the green area ahead points to a continuation of the uptrend. The cloud itself is currently acting as a potential support zone.
The breakout from the red area confirmed that, following a consolidation phase, buyers have regained control.
While the recent increase in whale numbers hinted at a new wave of accumulation, the halt in this trend suggests that major players may be reluctant to commit more capital at current levels. This could limit short-term upside potential.
Ichimoku Cloud for BTC. Source: TradingView
The blue line (Tenkan-sen) is still above the red one (Kijun-sen) — this indicates that short-term momentum is stronger than the medium-term trend. However, both lines have started to level out, which may signal a pause or a slight correction.
The green lagging line (Chikou Span) is positioned above both the price and the cloud, reinforcing the bullish sentiment. But its approach toward the current price is a reason for caution: if BTC drops below the Tenkan-sen, it could be a signal for a decline.
BTC nears critical support
The exponential moving average (EMA) structure remains confidently bullish: short-term lines consistently stay above long-term ones, with a wide gap between them.
This arrangement suggests strong upward momentum and implies a continuation of the trend.
BTC is now approaching the next resistance level. If it breaks through, the price may set new local highs.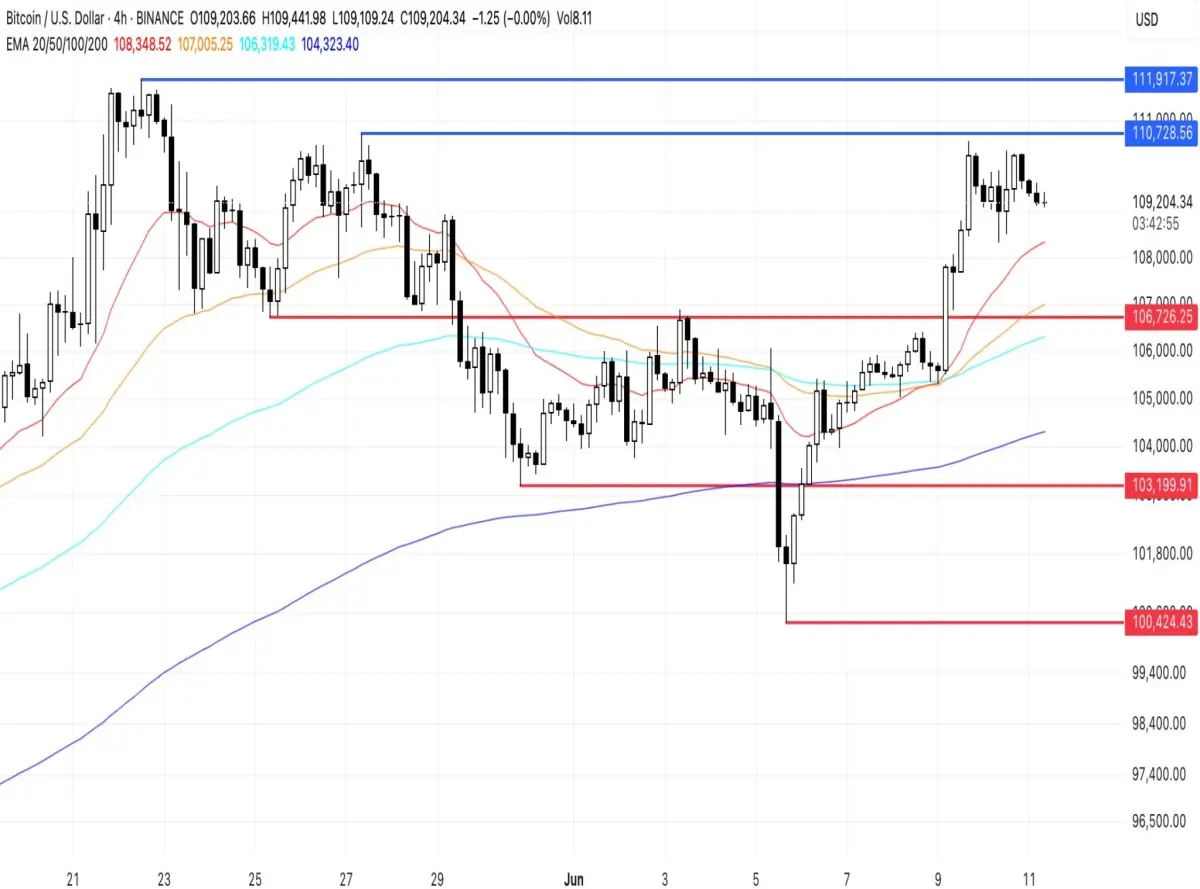
BTC Price Analysis. Source: TradingView
However, downside risks remain. If the support around $108,000 fails to hold, the price could enter a correction phase, gradually moving toward lower levels.
A break below the $106,700 zone would open the door to a deeper pullback, with the next potential targets at $103,000 and $100,400 if the downtrend gains momentum.






