
Life becomes complicated when you look from too close. Let's take a step back and look at the simple picture.
Fibonacci analysis for bitcoin (weekly graph)

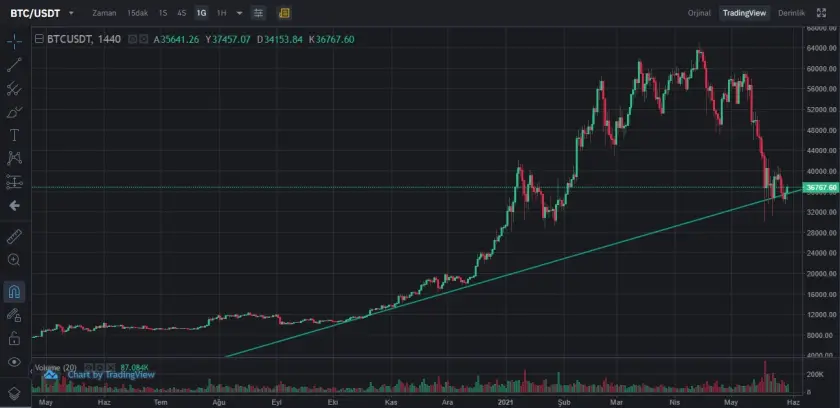
Resistance line for bitcoin (daily graph)
Fibonacci analysis for ethereum (weekly graph)

Resistance line for ethereum (daily graph)

So, it does not seem too bad from a long-term approach.
Historical data shows that best 10 and worst 10 months in the market generate the major part of the profit/lost. It is a good idea to avoid worst 10 months, but investors tend to miss best 10 months. Perfect forecasting is impossible; therefore, do not spend all of your life on a screen.






