
What's goin on, Investors?
Current Market Status (As of February 15, 2026)
Price Action: Bitcoin is trading at $68,952, at the time of writing, down 0.68% in the last 24 hours after briefly reclaiming $70,000 earlier in the week
The price has recovered from lows near $60,000 but faces resistance at the $70,000 level.
The Fear & Greed Index Paradox: The Crypto Fear & Greed Index recently hit a historic low of 5 (Extreme Fear) on February 7, 2026, the lowest reading since the index's creation and surpassing the multi-year low of 9 set just a day earlier.
This represents deeper anxiety than the FTX collapse in 2022 or the COVID crash in March 2020. Even as prices recover, sentiment remains deeply pessimistic, with the index sitting in "extreme fear" territory throughout February
 .
.
Key Data Points Confirming My Analysis
The Capitulation Thesis
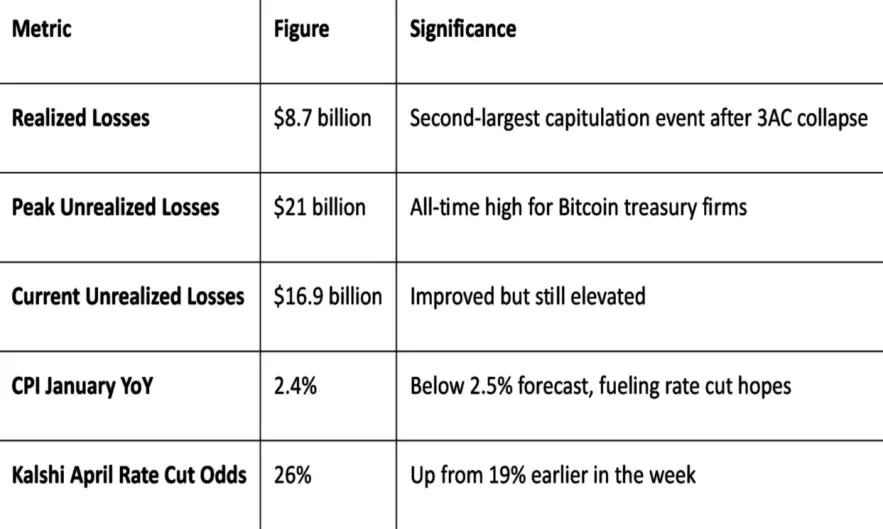
The $8.7 billion in realized losses represents what Bitwise analysts describe as a "textbook capitulation event."
This massive wealth transfer from weak hands to conviction investors historically marks market stabilization phases, though the redistribution process requires time to materialize fully.
The technical setup shows thinner weekend trading volumes supporting the rally, suggesting seller exhaustion rather than robust buying demand
This creates a fragile recovery vulnerable to reversal.

Critical Market Psychology
Bitwise research analyst Danny Nelson's observation captures the core dilemma: the market's "main driver right now is fear. Fear that we'll go lower."
This psychology manifests as "sell the rally" behavior, where any bounce triggers profit-taking and new short positions, potentially capping upside momentum until the supply transfer to stronger hands completes.
The confluence of extreme fear readings with price recovery creates an unusual divergence; typically, sentiment improves as prices rise. The persistence of fear suggests investors view this as a relief rally within a broader downtrend rather than a sustainable bottom.
My Final Thoughts
While the inflation-driven relief rally and massive capitulation losses suggest potential stabilization, the extreme fear gripping the market indicates that the psychological recovery lags behind the price recovery. The coming weeks will determine whether this represents a genuine market bottom or a temporary pause in a larger correction.
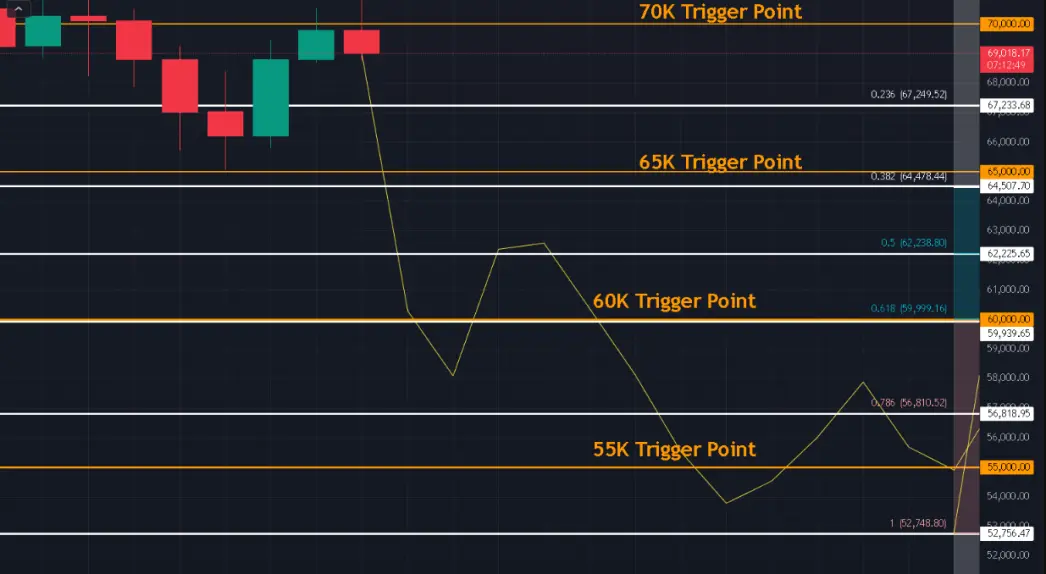
Based on a prediction tool (see the pic above), I predict the price could drop to 55K levels within a week or two. The yellow line is the prediction, and the white lines are Fib lines. This tool is about 70% accurate most of the time on the hourly chart, but this is the daily chart, and I have never used it on a daily chart.
Until next time, The Dark Sage singing out ✌️
Faucets That Work:
POLYGON ECOSYSTEM TOKEN FAUCET
Banks & Exchanges:
CAPITAL ONE SHOPPING GET 40.00 for YOU & 40.00 for ME






