For all of us trading cryptocurrencies and trying to make some money consistently nowadays, Tradingview is an invaluable tool; you can build charts of any tradable asset being traded in any exchange and not only for cryptos but also for traditional markets, beware that some fees may apply depending on what you are trying to chart, but for the most part, if you are only looking at cryptos you could use a free account which is already quite powerful for basic analysis, this free account will let you have up to three indicators in your charts.
Now let’s assume you get better at this and you start using more and more tools, you would want to analyze the price using one or more moving averages, Fibonacci levels, volume, and volume-based indicators, maybe add a MACD, RSI or Stochastic and so on, the list can grow as large as your imagination allows it, and you will want to see many of this indicators at the same time so you can compare signal from multiple sources.
Then there is the topic of simplicity, how many indicators and levels should you monitor but that is a different discussion, the point is that soon you will need more than the three simultaneous indicators you can use with the free account; what to do then? You could start increasing your account level by paying the fees for a PRO account which allows you to use 5 indicators per chart, believe me, you will soon want to go beyond this as well, then the PRO+ account or the Premium, all those are fair options but what if I tell you there is another alternative, in which you could combine for example multiple MAs in a single indicator that way instead of using one of your three free indicators for a 50 DMA another for the 100 DMA and the last one for the 200 DMA you could merge all of them and more in a single indicator freeing the other two for different tools…
YES! This can be done with a scripting language called Pine which is embedded in TradingView and you can use it to write programs that will do this job for you.
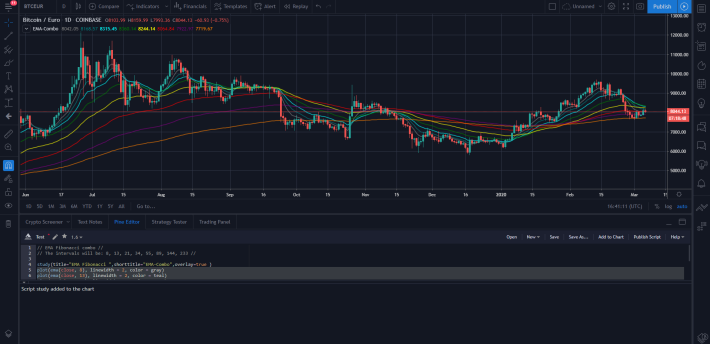
Let’s start with a basic example, an EMA Combo based on the Fibonacci sequence, bear with me is a lot simpler than it sounds. So, let’s say we would like to see several different EMAs let’s say 8 of them at the same time and that we will use the Fibonacci sequence as the time parameter, so, in a daily chart we want to see the 8,13,21,34,55,89, 144 and 233 daily EMAs.
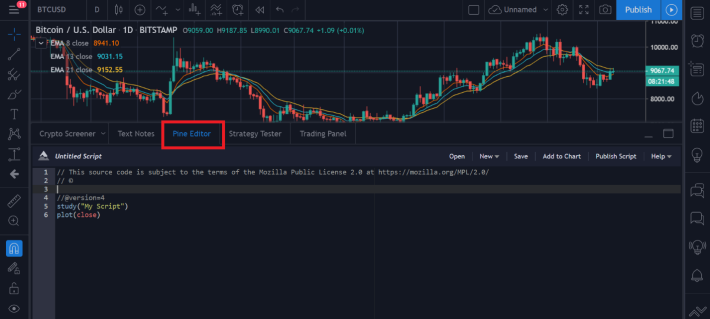
If we want to do this in the traditional way with a free account… is not possible but we will get something like the following image with the first three:

Three EMAs and that’s it you have reached your limit.
Now let’s explore option number two, at the bottom of the screen press the “Pine Editor” option, you will see that a small text editor opens right below your chart with the default information, all the lines starting with the double dash // are comments, they don’t affect your script they are there just to help you document your work for yourself or others who may use your script afterward.
Let’s start there, by giving our script a brief description, enter the following lines:
// EMA Fibonacci combo //
// The intervals will be: 8, 13, 21, 34, 55, 89, 144, 233 //
Next, let’s give it a title, this will be displayed when we search for it, we will do it with the following line, the short title option will be visible once the script is applied to the chart:
study(title="EMA Fibonacci ", shorttitle="EMA-Combo", overlay = true )
Now let’s draw or plot the actual EMAs in our chart with the plot command, here we will introduce the EMA function stating that we want to use the closing price of the time period specified (8,13,21,34,55,89,144 and 233), we can also specify other characteristics such as width and color of the lines for better visualization. It looks like the following:
plot(ema(close, 8), linewidth = 2, color = gray)
plot(ema(close, 13), linewidth = 2, color = teal)
plot(ema(close, 21), linewidth = 2, color = aqua)
plot(ema(close, 34), linewidth = 2, color = green)
plot(ema(close, 55), linewidth = 2, color = yellow)
plot(ema(close, 89), linewidth = 2, color = red)
plot(ema(close,144), linewidth = 2, color = purple)
plot(ema(close, 233), linewidth = 2, color = orange)
Then we give it a name, “Test” in this example and save it, then press the Add to Chart and voila you should be able to see the following:
This was a short and basic example, but in the same way, we combined several EMAs you should be able to develop more complex and interesting studies with different types of indicators, feel free to copy this script and use or modify it in your account, for full guides and resources on Pine I strongly recommend you to check the following pages:
https://kodify.net/tradingview-programming-articles/
Also to get your Tradingview account please visit: my referral link here:
Additional resources:
Useful resources on how and where to find the best information PART 2
Exchanges
Coinbase (get $10 when you buy or sell $100 on Coinbase): https://www.coinbase.com/join/rodrig_rxf
Binance (get 5% commission kickback): https://www.binance.com/en/register?ref=OV02LQ1E
Kucoin: https://www.kucoin.com/?rcode=2wsw7
Storage
Once you have purchased some currencies the best way to keep them is in your own hardware wallet, not on the exchanges, for that, I recommend the Ledger line of wallets reliable and easy to use, you can review and purchase here:
https://shop.ledger.com/pages/ledger-nano-x?r=bc24928c68ad