
Since the start of the week Bitcoin has lost roughly 8% in value, and its only Tuesday. This decline should not have caught traders off-guard as Bitcoin was showing signs of weakness since Trumps inauguration which was a defining factor in BTC’s rise to $100,000. On that very day Bitcoin made its all-time high of $109,000 the original digital asset was not able to hold onto most of those gains closing $7,000 below the record high forming a candle with a small body and a long upper wick resembling a shooting star with a range of about $10k.
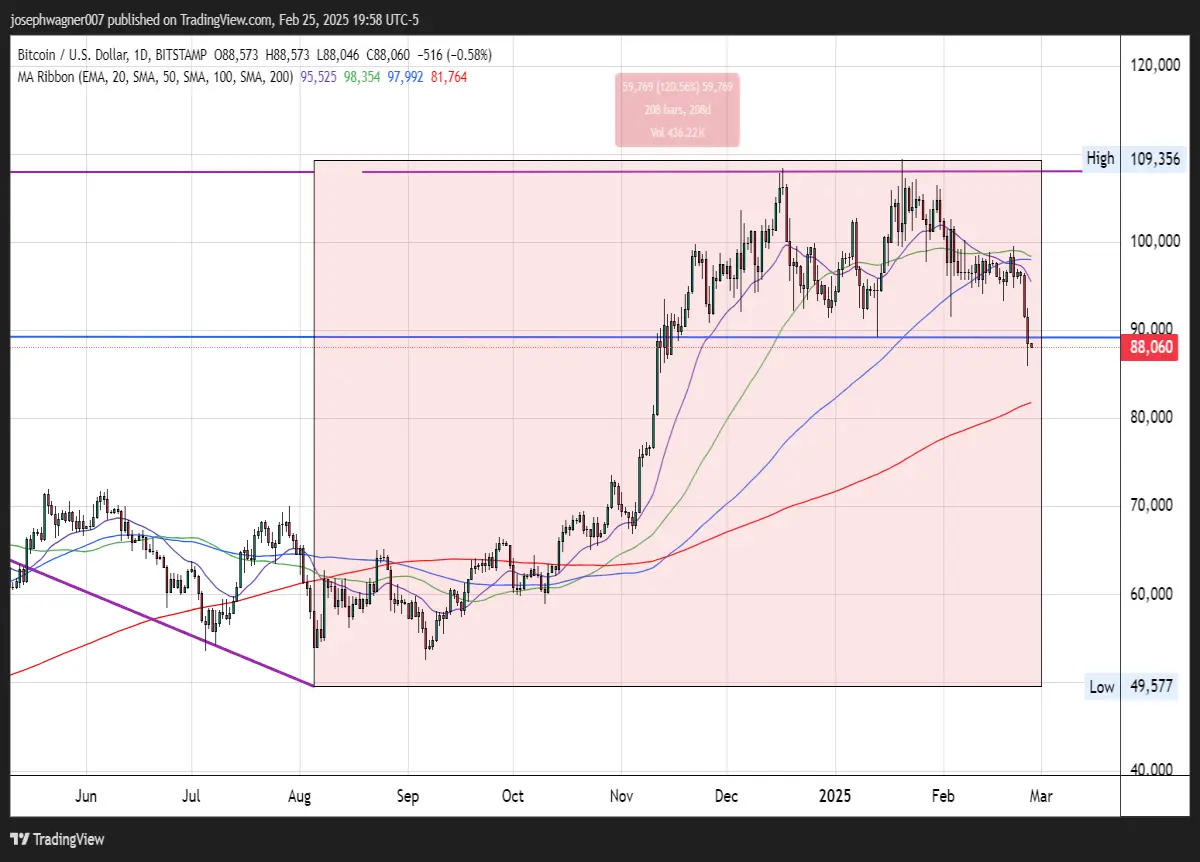
The following day January 21st BTC would make its highest closing price of roughly $106,000. Since then, we remained stuck in the range between $106k and $90k a trading range that lasted 98 days total. Those near 100 days of consolidation came to an end today when Bitcoin crashed through long standing support at $90,000.
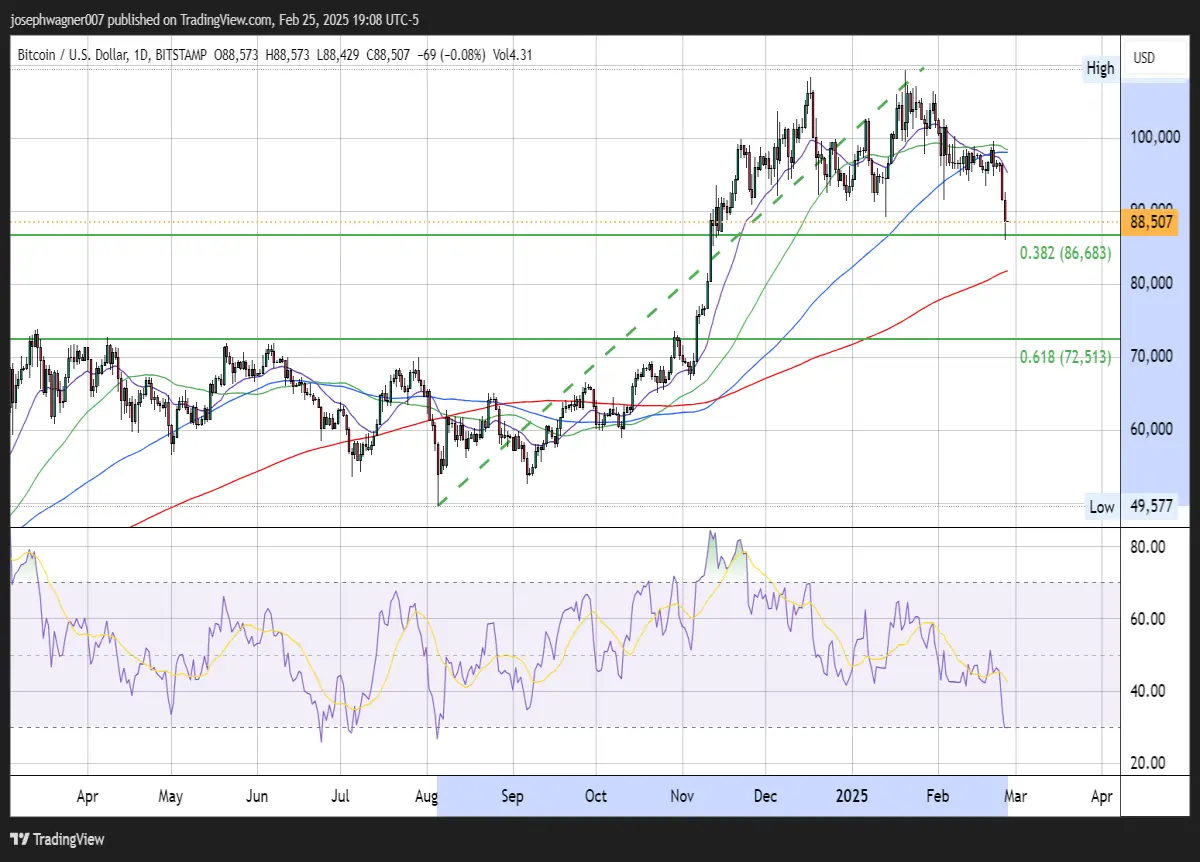
But there is some reason to hold onto hope as some technical studies are pointing to the fact that this correction may be over soon. The first hint that Bitcoin may have made its low or a level of consolidation before moving lower is today’s candle. At 6:50 PM ET, Bitcoin is pegged at $88,674 which is about $3,000 up from today’s low beneath $86k. the low also matches up with a 38% Fibonacci retracement from the low of August 4th near $57k to the ATH. This level served as support preceding its breach of $100k.
The RSI is also about to enter oversold territory according to the study. Bitcoin’s current score of 30 puts it on the edge of being oversold, which is represented by a score less than 30. The last time BTC’S RSI was this low was at the start of our Fib retracement back at the start of August, when pricing was in the $56,000 area.
However, the decline could easily stretch further the next two areas where BTC could find support are $81,000 and $72,000. $81k represents the current 200-day simple moving average. The next area holds more weight as a support zone $72,000 this price point served as ultimate resistance for the asset marking five consecutive tops in BTC made right before and after the April 2024 halving, as well as one noteworthy top seen in October 2024 before BTC finally broke above this resistance level in November 2024. The price point of $72k also matches the 61.8% Fibonacci retracement level from the same data set cited earlier ($57k – $109k).
Whether or not Bitcoin consolidates before heading lower it is likely that lower is the path of least resistance after such a phenomenal run made over the past 200 days at its peak BTC had gained 120% in that short of a period.
Several Fibonacci extensions utilizing various rallies over the past few years has indicated that the ATH was a likely top in Bitcoin. The 8% decline over the past two days is really nothing looking at the big picture and I see BTC dropping a decent amount further before bouncing back. Technical studies and historical action point to $72,000 as the most likely target for a bottom.
For anyone interested in our Bitcoin trading service simply click this link to sign up for free.






