
Historical data show severe crypto corrections unfold slowly, driven by shifting liquidity and risk appetite.
Severe drawdowns alter not just price levels, but the tempo of markets. When losses deepen beyond routine corrections, volatility behaves differently, narratives fracture, and investor psychology shifts from optimism to capital preservation. Bitcoin is currently down roughly 52 percent from its peak, placing it firmly in what historical data describe as rare drawdown territory.
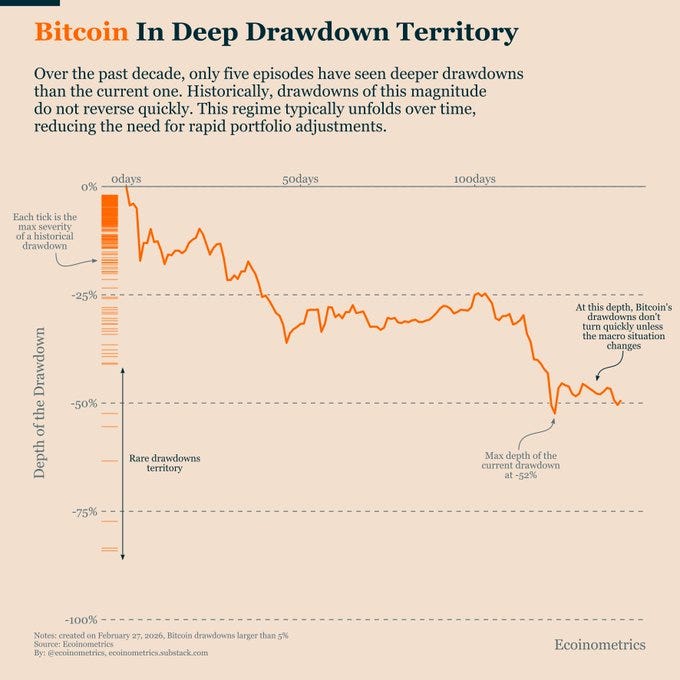
Over the past decade, there have been only five episodes deeper than this one. History suggests that once Bitcoin enters this zone, recoveries rarely happen overnight. The pattern is less about dramatic V-shaped rebounds and more about extended recalibration.
A Rare Historical Zone
Data compiled by Ecoinometrics show that as of February 27, 2026, Bitcoin’s drawdown exceeds 50 percent from its most recent all-time high. The chart highlights that only five periods in the past decade have experienced deeper declines. Each tick on the left-hand axis marks the maximum severity of historical drawdowns, underscoring how infrequently Bitcoin trades in this range.
A 52 percent decline is not a routine correction. It places Bitcoin in what can fairly be described as structural reset territory. Historically, drawdowns of this magnitude tend to persist. They unfold over weeks and months, often marked by failed rallies, choppy consolidation, and a gradual rebuilding of conviction.
This behavior aligns with the broader academic literature on financial drawdowns. Research from institutions such as the National Bureau of Economic Research has shown that deep asset price contractions tend to be associated with regime shifts in liquidity, macroeconomic expectations, or risk tolerance rather than simple technical overextensions.
The COVID Exception
The only recent episode that deviated from the slow-resolution pattern was the March 2020 crash during the onset of COVID-19. Bitcoin fell sharply alongside global equities during the panic. However, the recovery was swift, largely due to extraordinary policy intervention. The Federal Reserve and other major central banks deployed unprecedented monetary stimulus, slashing interest rates and injecting liquidity at a historic scale.
Fiscal authorities followed with expansive spending packages. The macro backdrop shifted almost instantly from forced deleveraging to abundant liquidity. Bitcoin’s rebound during that episode was not purely endogenous; it was amplified by an environment of synchronized global easing and expanding risk appetite.
That backdrop does not characterize today’s environment. Monetary conditions are tighter, real yields are structurally higher than during the zero-rate era, and global growth remains uneven. Without a comparable policy shock in the opposite direction, the probability of a rapid V-shaped recovery diminishes.
How Deep Drawdowns Typically Unfold
Severe drawdowns change the rhythm of the market. Momentum weakens. Breakouts fail. Short-term rallies are sold into rather than chased. Volatility compresses after initial capitulation, leading to extended consolidation phases. Historically, Bitcoin’s deep drawdowns have involved three recurring features:
-
First, Time. Extended bases often form over months rather than days. The market tests conviction repeatedly before establishing durable support.
-
Second, Sentiment reset. Bullish narratives that dominated during the ascent lose influence. Participants who entered late in the cycle exit. Long-term holders gradually absorb supply.
-
Third, Macro alignment. Durable recoveries typically coincide with improving liquidity conditions, renewed institutional demand, or structural catalysts that restore broader risk appetite.
The key point is that these processes are cumulative. They build incrementally. Durable recoveries are usually visible in hindsight because they are accompanied by broad confirmation across metrics such as on-chain activity, derivatives positioning, and macro risk indicators.
The Importance of Monitoring Risk Appetite
At a 52 percent drawdown, the strategic question is not pinpointing the exact bottom. Precision in timing is notoriously elusive, even for institutional desks with sophisticated models. Instead, the focus shifts to identifying inflection points in risk appetite. In previous cycles, sustained recoveries have aligned with measurable improvements in liquidity conditions, stabilization in equity markets, and a narrowing of credit spreads.
As risk assets broadly regain traction, Bitcoin tends to benefit from renewed capital inflows. Importantly, these shifts do not occur overnight. They emerge through a series of incremental signals: higher lows in price structure, strengthening relative performance versus equities, and persistent inflows rather than episodic bursts of speculation.
The gradual nature of these transitions means investors typically have room to adjust exposure once confirmation appears. The data suggest that urgency is rarely rewarded in this phase; disciplined observation often is.
Patience Over Prediction
The historical record argues for patience rather than urgency. When Bitcoin trades in deep drawdown territory, the market is engaged in a process of recalibration. That process has consistently required time. This does not imply inevitability in direction, nor does it preclude volatility. Instead, it reinforces a structural insight: severe contractions reset market dynamics.
They demand rebuilding of confidence, repositioning of capital, and realignment with broader macro conditions. Bitcoin remains a high-volatility asset embedded within the global risk ecosystem. When the rhythm changes, so must expectations. For now, history indicates that durable recoveries from 50 percent drawdowns tend to develop gradually, accompanied by observable improvements in liquidity and risk demand.
In markets, depth alters tempo. And tempo, more than price alone, often determines how the next chapter unfolds.
Originally Published on Substack.






