
The chart highlights the inverse relationship between the top two crypto-assets compared to inflation & interest rates
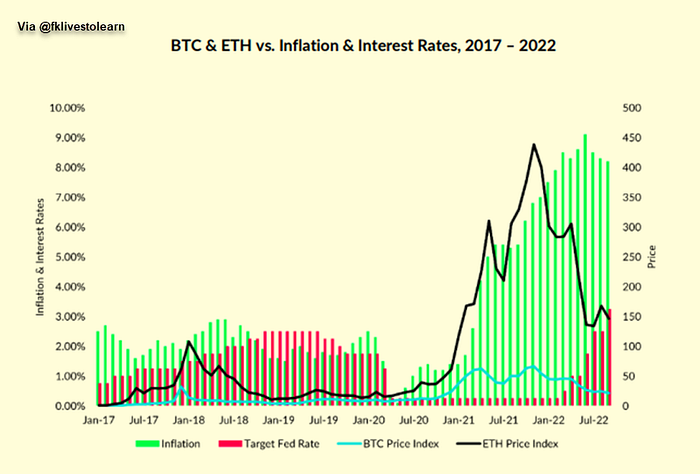
One of the most famous narratives floated by Crypto proponents over the years has been the ability of Bitcoin and other cryptos to act as an inflation hedge. Now that we have some qualitative data, we can analyze it to see whether this has been the case over the years. The chart above looks at the relationship between Bitcoin (BTC) and Ethereum (ETH) against inflation and interest rates in the U.S. — going back all the way to 2017.
According to CryptoCompare’s data, the top two cryptos have had an inverse relationship during this period. Before I delve a little further into the inflation hedge narrative not holding true, I do want to point out that Bitcoin has fared much better than the major fiat currencies against the US dollar, in the backdrop of a worsening macroeconomic situation recently. This was highlighted in the record money exchange from Euro & Pound to Bitcoin.
It is clear from the chart above, that Bitcoin and Ethereum have so far failed to act as an inflation hedge in the long term. What has happened is the acting of a long-rooted principle in finance — when interest rates increase to positive and non-zero, it means the present value of risky assets declines, given the opportunity cost presented by positive interest rates. And if anything Bitcoin, especially as acted as a risk asset.
And recent data vouch for that fact. In my earlier piece, I discussed how BTC’s inverse relationship with the USD and the direct relationship with tech-heavy Nasdaq had reached extreme levels — all pointing to the fact that Bitcoin and cryptos have evolved more into risk assets rather than safe havens against risk — at least in the short term.
Digital assets are still a novel asset class as they evolve & mature. We still need to look at a longer time data frame to confirm that the short-term risky asset narrative holds — hedge against inflation, not so much.






