
As Bitcoin defies market volatility, key technical and on-chain indicators suggest the bull run may not be over yet.
As traditional financial markets grapple with tariff-induced volatility, Bitcoin has remained remarkably resilient, maintaining its upward trajectory despite global economic uncertainty. With increasing geopolitical tensions and trade restrictions affecting legacy markets, investors are turning to Bitcoin as a hedge against inflation and currency devaluation.
But beyond macroeconomic drivers, technical and on-chain indicators also point toward continued bullish momentum for the premier digital asset. Two key metrics—Bitcoin’s 200-week moving average and the proportion of short-term holders—provide compelling evidence that Bitcoin’s bull run is far from over.
200-Week Moving Average
The top chart (below) highlights Bitcoin’s historical price movements in the 200-week moving average (200W MA), a well-respected long-term technical indicator. Historically, Bitcoin’s price has consistently rebounded from this level during major market corrections, signaling strong support. The chart shows previous instances, where Bitcoin found a bottom near this key average before embarking on a substantial uptrend.
According to TradingView, Bitcoin's 200-week simple moving average (SMA) is currently at a record high of $44,200. While this is a significant milestone, it's worth noting that it remains well below Bitcoin's all-time high of $69,000, reached in November 2021. Why is this important? Let me explain. Previously, bull markets have concluded with the 200-week SMA reaching the peak price of the previous cycle.
For example, the 2021 bull market ended with the SMA at $19,000 (the 2017 peak), and the 2017 bull market ended with the SMA at $1,200 (the 2013 peak). If this pattern continues, Bitcoin's current price range of $90,000 to $110,000 could signal a bullish breakout and the start of the next leg up. Fast forward to 2025, and we see Bitcoin not only holding above the 200W MA but also using it as a launchpad for further gains.
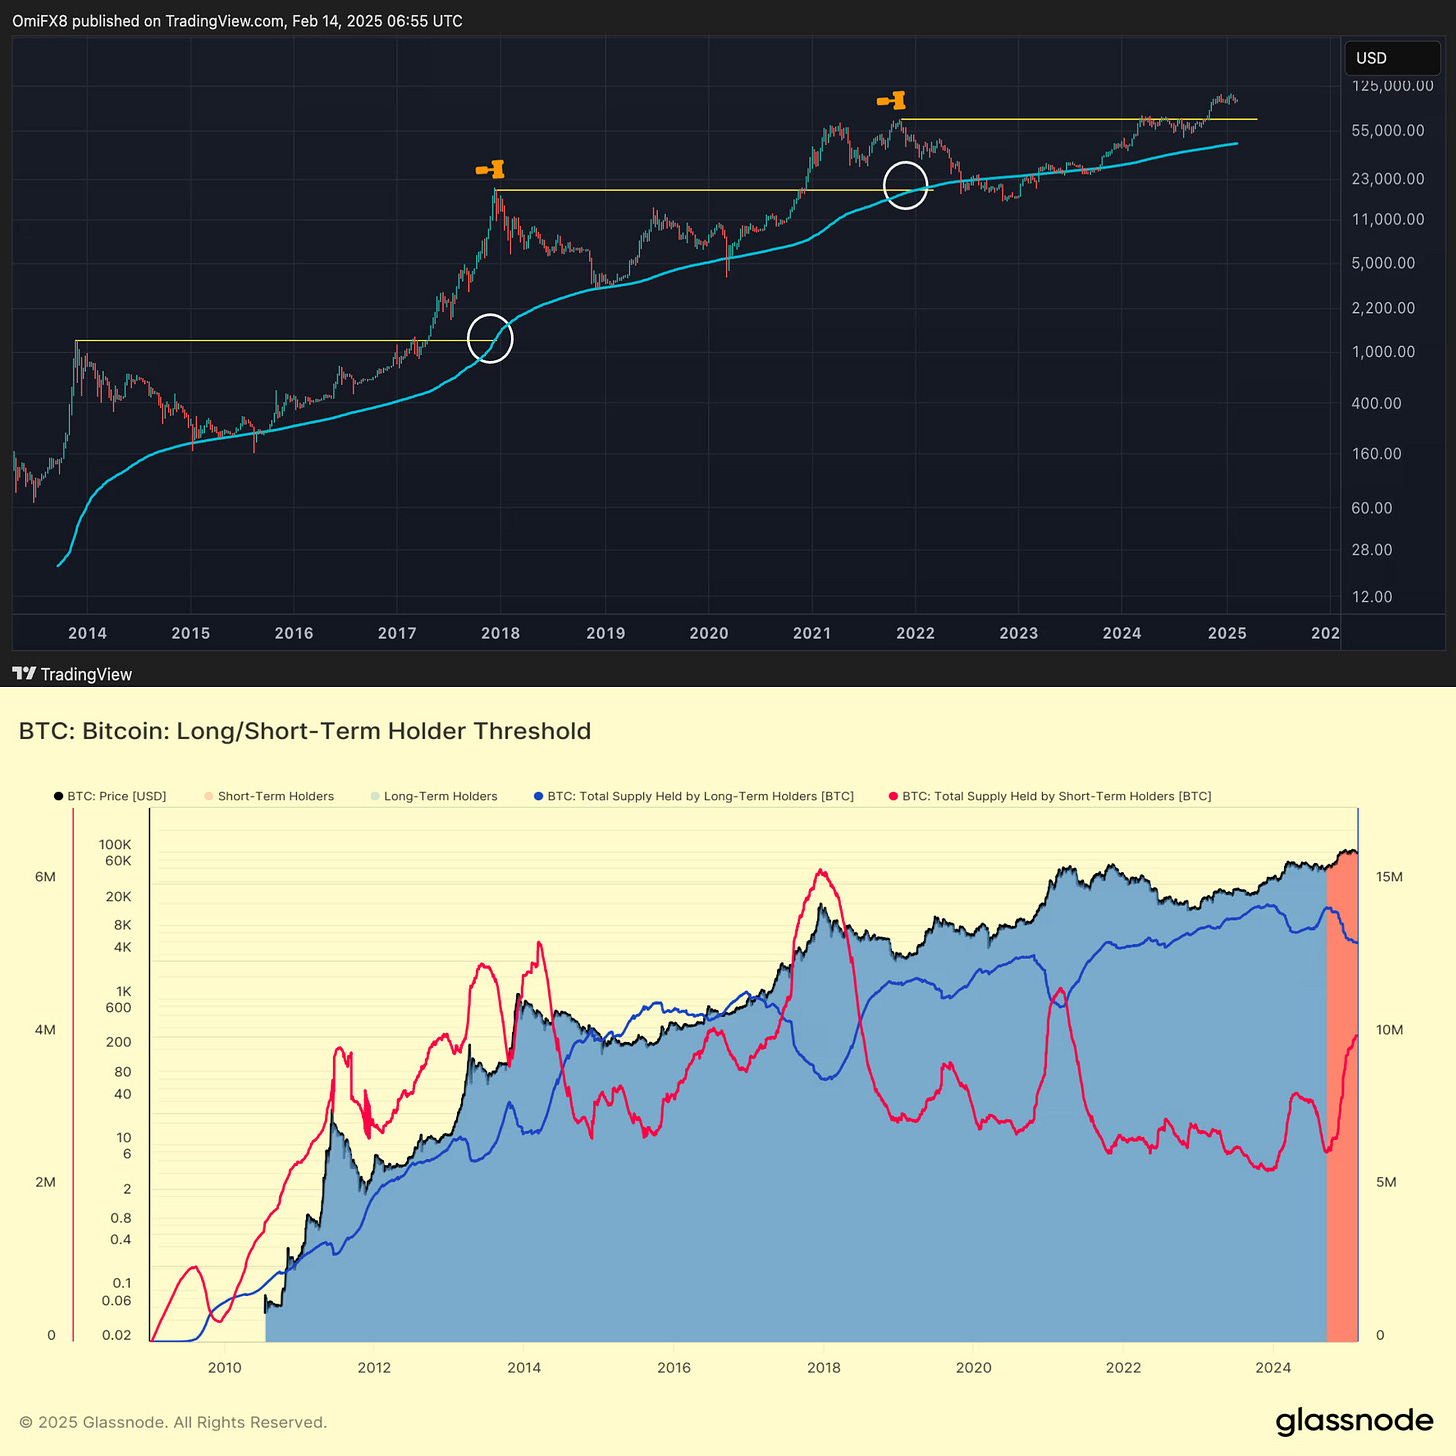
Short-Term Bitcoin Holders
The second chart focuses on Bitcoin’s long-term and short-term holder supply, offering insights into investor behavior. Historically, bull markets have coincided with a decline in short-term holder supply (red line), while long-term holders (blue line) accumulate more Bitcoin. This pattern suggests that speculative investors who buy during price surges eventually sell, while seasoned holders capitalize on dips and continue to strengthen their positions.
Since September, short-term Bitcoin holders (STHs), defined by Glassnode as those holding Bitcoin for under 155 days, have accumulated an additional 1.5 million BTC, bringing their total holdings to over 4 million BTC (second chart above). This represents an average monthly accumulation of roughly 300,000 BTC during a period when Bitcoin's price rallied from $60,000 to $109,000 before retracing below $100,000.
Historically, bull market peaks have coincided with STHs exhausting their buying power, a pattern observed in 2013, 2017, and 2021. However, at those previous peaks, STH holdings were significantly higher - 5 million BTC (2013), 6.2 million BTC (2017), and 4.6 million BTC (2021). The current STH holdings, being comparatively lower, suggest a potential for continued accumulation by new market participants, implying that this market cycle may still have room to expand.
Broader Macroeconomic Picture and Bitcoin’s Future
While technical indicators point toward continued bullish momentum, Bitcoin’s future price action will also be influenced by macroeconomic factors. Historically, digital assets have been susceptible to extreme volatility, and external shocks—such as regulatory changes, monetary policy shifts, or global economic slowdowns, could introduce short-term corrections.
However, Bitcoin’s increasing institutional adoption and its role as a hedge against financial instability suggest that its long-term growth remains intact. With supply dynamics favoring accumulation and the 200W MA acting as a solid foundation, the current bull cycle appears well-supported. Investors should remain cautious of short-term volatility & macroeconomic shocks, but recognize that Bitcoin’s fundamental strength continues to drive its long-term appreciation.
Disclaimer: The information provided in this article is for informational and educational purposes only and should not be construed as financial, investment, or trading advice. Readers are encouraged to conduct their own research before making any investment decisions.
Originally published at Substack.


