
Insights from the Forbes Global 2000 and OnDeck analysis on the highest-performing companies worldwide.
Revenue per employee (RPE) has emerged as one of the most practical and revealing metrics for evaluating workforce productivity. While it does not capture every dimension of business performance, it offers a straightforward way to measure how efficiently a company converts human capital into financial output. By dividing total revenue by the number of employees, RPE helps compare productivity across industries, business models, and time periods.
Although this metric does not reflect cultural strength, employee well-being, or long-term innovation capacity, it provides a useful lens for understanding how organizations scale and where they generate value. Recent data compiled by OnDeck, based on revenue and employee numbers from the Forbes Global 2000 list, highlights fascinating trends in global and sector-specific efficiency.
Global Leaders: Where Workforce Productivity Peaks
The global landscape presents dramatic contrasts shaped largely by industry type and operating models. Some organizations generate enormous revenue with lean teams, especially within resource extraction, high-margin manufacturing, and investment-driven enterprises.
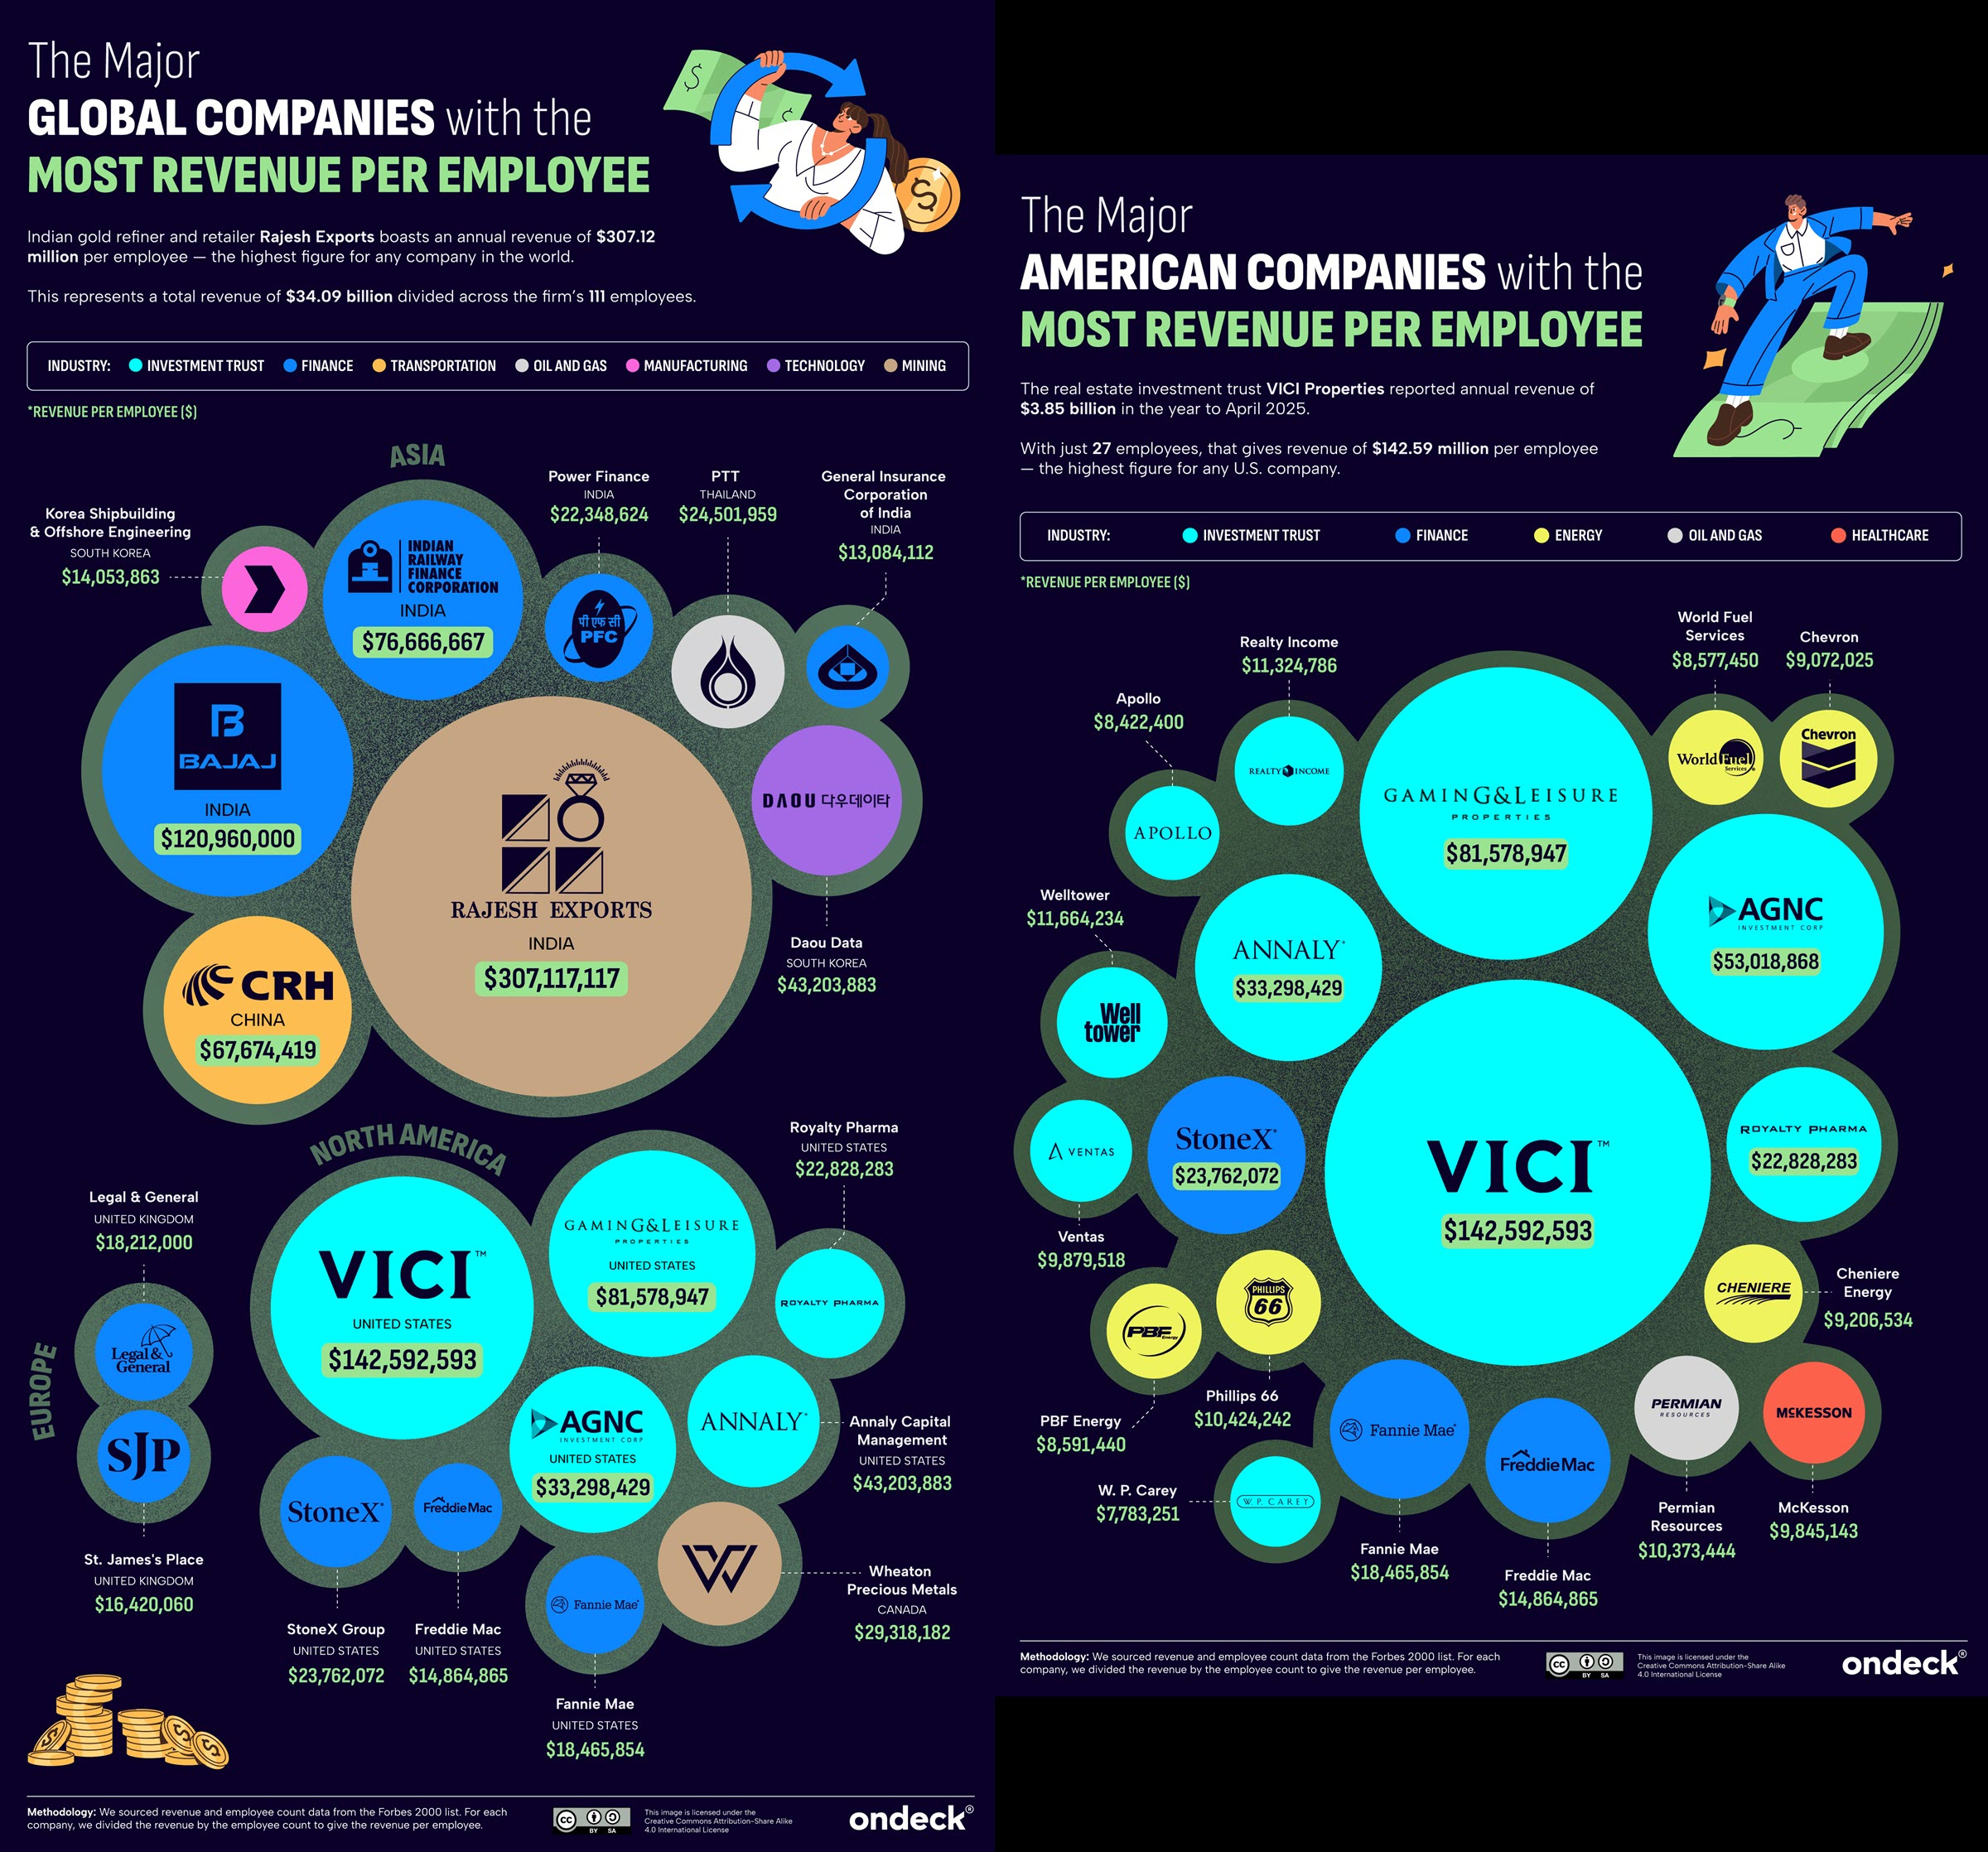
According to OnDeck’s analysis, India’s Rajesh Exports stands at the top with an extraordinary revenue per employee of approximately 307 million dollars. As one of the world’s biggest gold refiners and retailers, the company demonstrates how capital-intensive businesses with streamlined operational workforces can achieve huge output per person.
Other notable global leaders include:
-
Korean Shipbuilding and Offshore Engineering, with 14 million dollars per employee
-
Bajaj Auto of India with 120.96 million dollars
-
China’s CRH with 67.67 million dollars
-
The Power Finance Corporation of India with more than 76 million dollars
Such figures illustrate how concentrated value chains and specialized expertise often translate into high RPE numbers. Businesses in energy, heavy industry, and investment finance tend to dominate this part of the global ranking.
North American and European Productivity Patterns
In North America, VICI Properties, a real estate investment trust (REIT), achieves an exceptional RPE of 142.6 million dollars. With fewer than 30 employees and a revenue base exceeding 3.8 billion dollars, the company exemplifies how asset-heavy, employee-light business structures excel under this metric.
Other North American companies with strong RPE include:
-
AGNC Investment Corp. with 53 million dollars
-
Gaming & Leisure Properties at 81.5 million dollars
-
Royalty Pharma at 22.8 million dollars
In Europe, the picture diversifies. St. James’s Place, a UK-based wealth management firm, generates nearly 160 million dollars per employee, while Sweden’s Investor AB and the UK’s Legal & General showcase steady productivity within the investment and insurance sectors. These patterns reflect a core truth: industries with scalable capital, rather than scalable labor, consistently outperform others on RPE.
The Big Tech Perspective
The technology sector offers a different kind of insight. While tech companies often employ thousands of people, many still maintain exceptionally high RPE numbers due to software-driven scalability and ecosystem-level revenue streams.
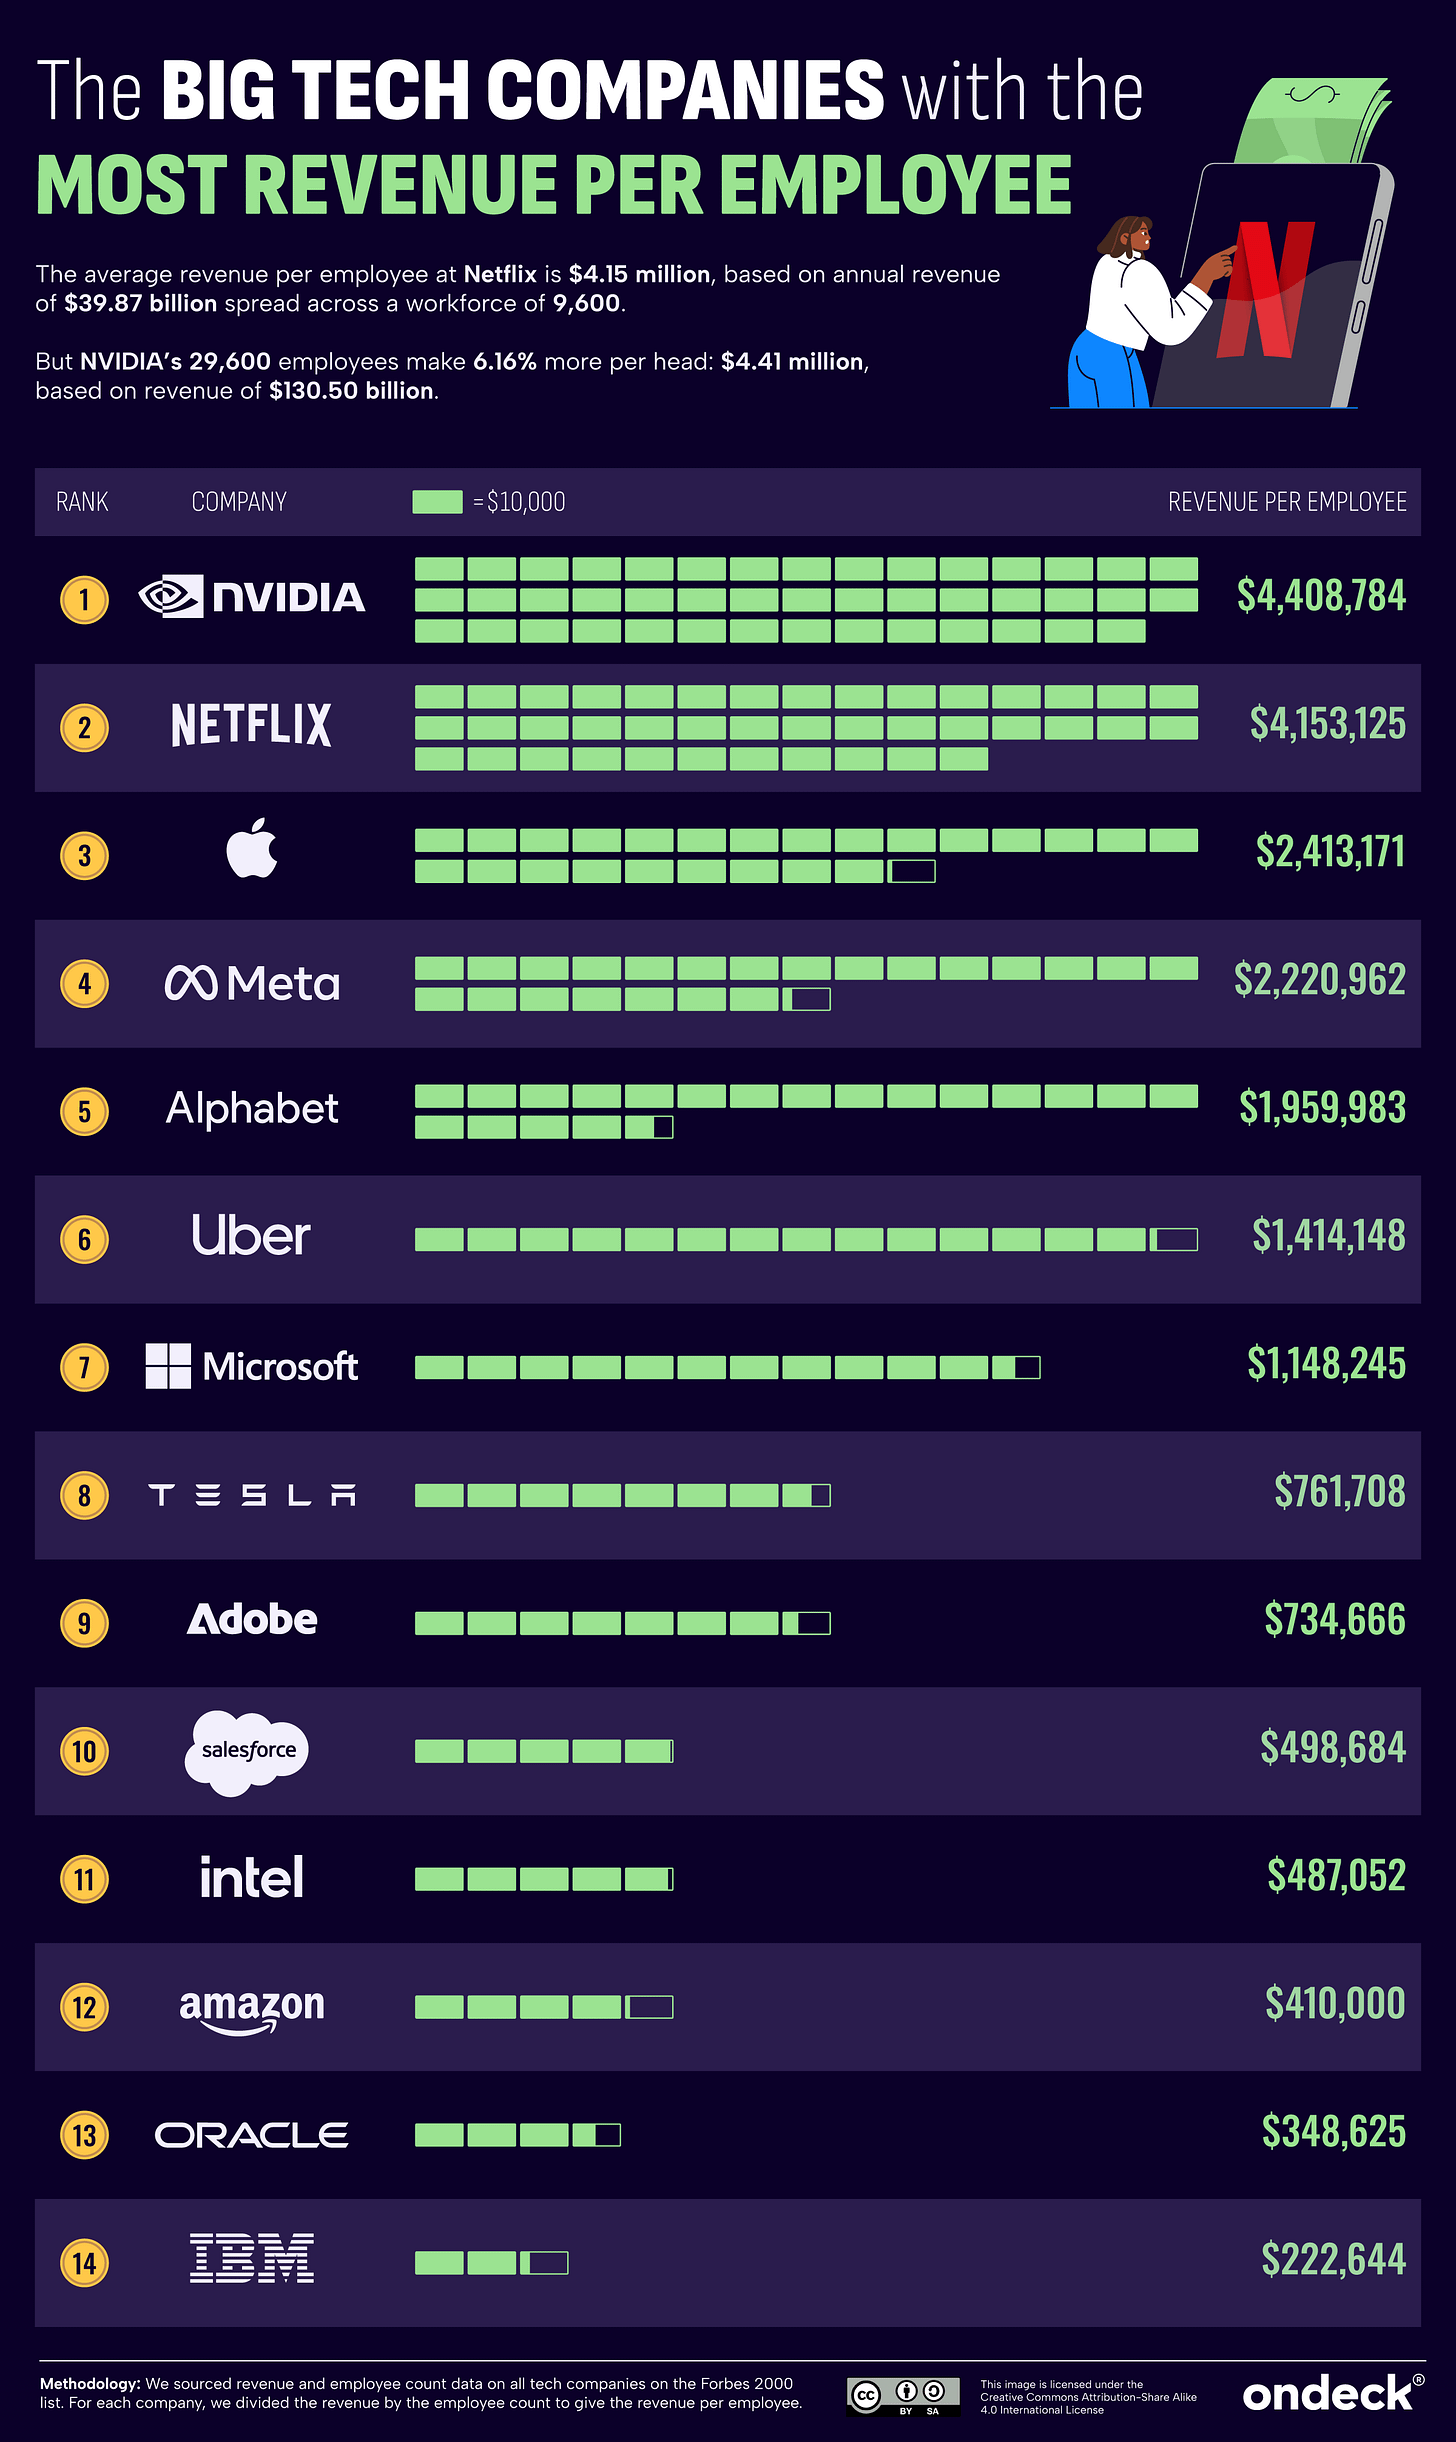
Among major tech players, NVIDIA leads the ranking with RPE of about 4.41 million dollars. Its dominance reflects the surge in demand for GPUs powering artificial intelligence and cloud computing. Netflix follows closely at 4.15 million dollars per employee, supported by its digital-first business model and global subscriber base.
Other tech leaders include:
-
Apple: 2.41 million dollars
-
Meta: 2.22 million dollars
-
Alphabet: 1.96 million dollars
-
Uber: 1.41 million dollars
-
Microsoft: 1.14 million dollars
Even companies with more traditional structures, such as Intel and Oracle, still maintain RPE figures between 348,000 and 487,000 dollars.
This wide range underscores how varied the tech ecosystem truly is. Companies deeply invested in hardware or logistics tend to show lower RPE numbers than those whose revenue comes primarily from software, subscriptions, or digital platforms.
What RPE Really Tells Us?
Revenue per employee is not a perfect measure. It does not capture innovation potential, employee satisfaction, or societal value. A company with high RPE may still struggle with culture, sustainability, or long-term competitiveness. Meanwhile, labor-intensive industries such as retail, healthcare, and hospitality understandably show lower RPE values despite playing vital roles in the global economy.
Still, RPE remains a powerful tool for assessing efficiency trends. When viewed year-over-year, it reveals whether companies are gaining productivity or expanding workforce size faster than revenue. When compared across industries, it highlights the structural strengths of different business models.
Most importantly, it encourages organizations to think about their workforce in terms of the value created rather than the cost incurred. In a world where efficiency, automation, and digital transformation shape competitive advantage, RPE offers a window into how companies are adapting — and which ones are redefining what productivity looks like.
Originally Published on Substack.






