After months of downward pressure, ETH/BTC is showing signs of a potential trend reversal that crypto traders should be watching closely.
What the chart below tells us:
📊 The Setup:
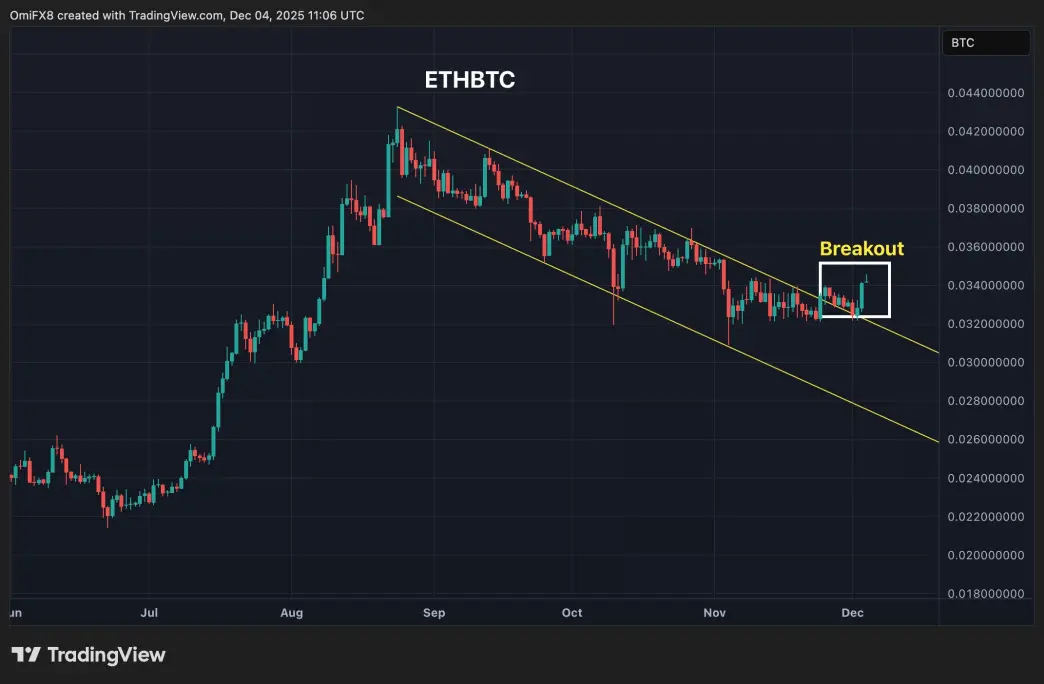
- ETH/BTC has been trapped in a descending channel since August 2025
- Price declined from ~0.044 BTC to lows near 0.032 BTC (27% drop)
- Multiple failed breakout attempts throughout October-November
🔍 The Breakout (December 2025):
- Price has broken above the upper resistance trendline
- Currently trading around 0.034-0.035 BTC
- Volume appears to be supporting the move
- This is the first convincing break of the multi-month downtrend
Technical Implications:
✅ Bullish Case:
- Descending channel breakouts often lead to strong momentum moves
- If confirmed, the measured move suggests potential toward 0.038-0.040 BTC
- Breaking consolidation after an extended downtrend can signal accumulation completion
- RSI likely exiting oversold territory (bullish divergence setup)
⚠️ What to Watch:
- Confirmation needed: A close above 0.0355 BTC would strengthen the breakout
- Retest zone: 0.033-0.034 BTC (former resistance becoming support)
- False breakout risk: Price must hold above the trendline; failure = continued downtrend
- Volume: Sustained buying pressure is critical for follow-through
Context for the Ratio:
The ETH/BTC pair reflects Ethereum's strength relative to Bitcoin—essentially answering "should I hold ETH or BTC?" A rising ratio suggests ETH outperformance. After Bitcoin's dominance throughout 2024-2025, this potential reversal could signal:
→ Risk-on sentiment returning to crypto markets
→ Renewed interest in smart contract platforms
→ Rotation from BTC profits into altcoins
→ Ethereum network developments gaining traction
The Trader's Dilemma:
Early breakout entries offer the best risk/reward but carry false breakout risk. Waiting for confirmation (retest of 0.033-0.034) offers more conviction but less upside. This setup matters beyond day trading—it could signal the beginning of "alt season" if ETH starts leading the market higher against BTC.
My take: This is a chart worth monitoring closely over the next 7-10 days. The breakout is happening, but confirmation is everything. One clean weekly close above resistance could change the entire narrative for Ethereum's relative performance.
For the crypto community: Are you watching ETH/BTC as a leading indicator for altcoin season, or do you think Bitcoin dominance continues regardless of this technical setup?