
Visualizing the performance of different segments of the crypto market at the end of the second quarter
While the first half of the year and the second quarter specifically have brought a lot of pain for the crypto bulls, the third quarter is shaping up nicely — we are seeing signs of stabilization, to say the least. Most of the time, Bitcoin is the one that leads the way. However, in the past week, the smart contract pioneer, Ethereum has shown the way. Over 40% surge that we have seen in ETH is being attributed to the upcoming merge of its blockchain network in its transition towards a more efficient & scalable Proof of Stake (PoS) network.
In addition to the merge and increased risk appetite, structural effects might have also contributed to lifting Ether. The contagion fears that were sparked by the collapse of the Terra Luna stablecoin (UST) had investors on the edge for weeks. Things got even worse when Celsius Network, one of the world’s largest crypto lenders, filed for Chapter 11 bankruptcy — listing between $1B-$10B in assets and more than 100K creditors. We are now hearing that Celsius has repaid its DeFi loans.
Although it might be too early to say the crypto market might have bottomed, the price action in Bitcoin & Ethereum certainly suggests that the market stress in digital assets might be showing signs of settling down. At the time of writing, BTC is trading @ $23.4k, while ETH is trending close to $1573 — having crossed $1600 earlier. But the picture just a couple of weeks ago looked much less rosy and that’s what we are going to look at in today’s piece.
Data for today’s article was gathered from CoinGecko’s report, which you can access for a more detailed analysis. Let’s dig into some of the headline numbers and statistics to make sense of what happened in Q2.
Spot Market Overview
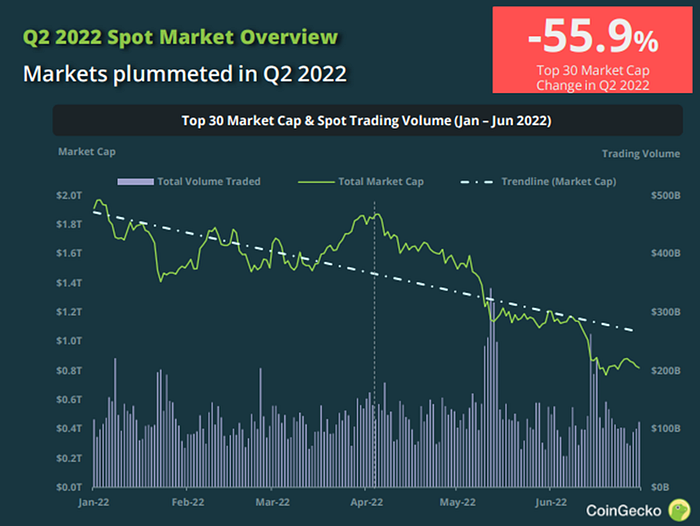
- Top 30 cryptocurrencies' market cap saw a drop of 55.9% in Q2 2022 — losing over half its value, it dropped below $1 trillion.
- Measured from the peak reached in Nov. 2021, the market cap retreated from an all-time high of $2.6 trillion to just $800 billion — registering almost a 68% loss.
- Spot trading volumes remained relatively stable at around $100 billion, apart from the USTC collapse in May & a market sell-off in June.
- LUNC and USTC fell out of the Top 30 for obvious reasons, while stablecoins BUSD and DAI previously at №13 and №20 climbed to №6 and №12 respectively. XMR, OKB, LEO, and UNI were some of the other additions to this club.
- In Q2, Bitcoin dominance remained roughly the same as in Q1 at 46.8%, while ETH fell from 21.4% to 16.3%. Within the Top 15 cryptos, BNB, DOGE, and TRON increased their relative market share to 4.4%, 1.1%, and 0.73% respectively.
Stablecoins Overview
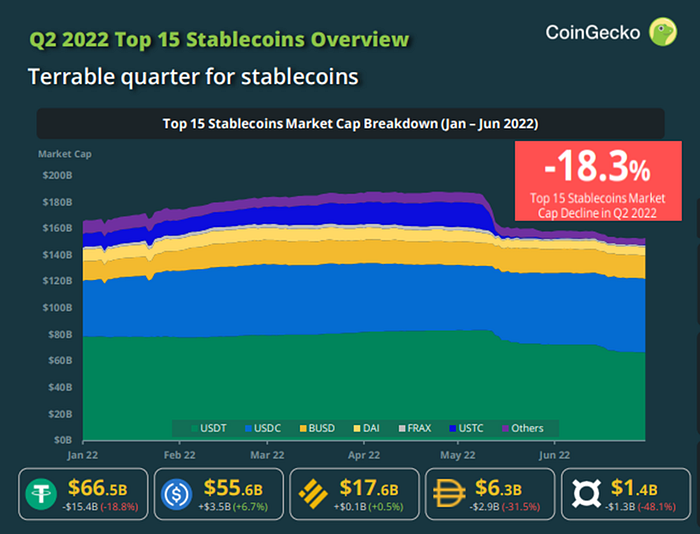
- Top 15 stablecoins lost almost a fifth of their market cap, or $33.9 billion in absolute terms — thanks to the UST collapse. Before its collapse, UST overtook BUSD as the third largest stablecoin.
- Despite the UST collapse, the overall stablecoin market remained healthy as investors hedged into stables amidst market uncertainty.
- Within the Top 30 cryptos, stablecoins USDT, USDC, BUSD, and DAI now make up 17.8% of the market share.
- While Tether (USDT) retained its top sport in stablecoins, its share decreased by almost 20%. USDC was a close second and took the lead in Q2 in terms of growth with close to a 7% increase.
- FRAX and DAI however saw losses of 48% and 32% in market cap respectively.
Bitcoin Performance
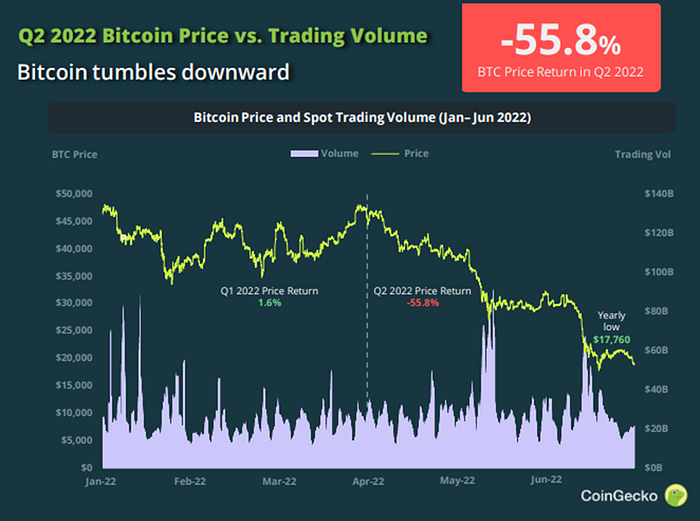
- Since the premier crypto has huge market dominance, the losses in BTC are usually replicated in the overall market — BTC price plummeted by -55.8% in Q2.
- At one point, Bitcoin recorded 9 consecutive weeks of being in the red, the first time this has happened — breaking significant psychological price levels like $30k and $20k respectively, eventually posting a yearly low of $17,760.
- A number of factors influence this massive price fall in Q2 — extreme risk-averse sentiment in financial markets, macroeconomic conditions, Three Arrows Capital insolvency (large holdings of GBTC) & LFG Foundation’s sell-off of their BTC holdings (to protect the UST peg) all exacerbated the decline.
DeFi Overview
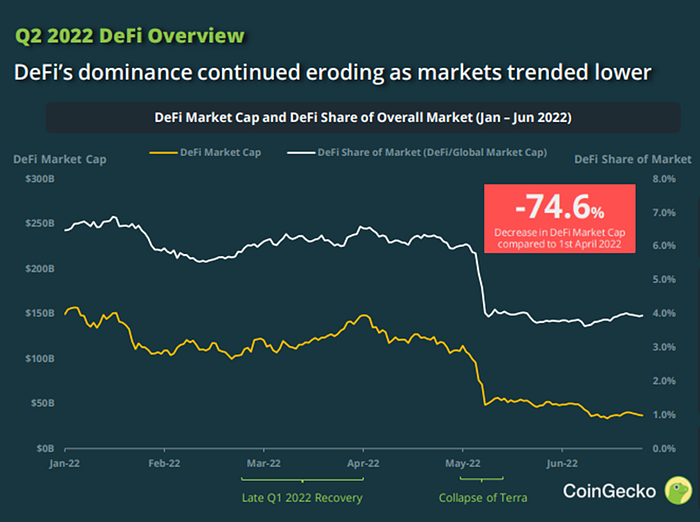
- Decentralized Finance (DeFi) saw the biggest decline in any of the crypto market segments — decreasing from $142 billion to $36 billion, or -74.6% in market cap.
- Most of this hefty loss could be attributed to the collapse of UST. It wasn’t just the Terra ecosystem projects that were wiped out, it took down protocols that supported these assets as well.
- This event had a widespread contagion effect in the Cryptoverse, as panic redemptions in Tether (USDT) & other algorithmic stablecoins led to their depegging.
- Besides this, DeFi is already suffering from mounting cyberattacks and exploits, amounting to investors’ lost faith in decentralized protocols.
- In Q2 2022, Ethereum regained some of its TVL dominance in DeFi, as altcoins started to shrink. While Ethereum has increased its share of TVL from 54% to 60%, its overall TVL is still 52% lower compared to Q1 2022.
- While the market cap has taken a severe beating, it seems that activity within DeFi has fared much better — average daily DeFi users only declined only by 34.5% in the second quarter.
NFT Volumes
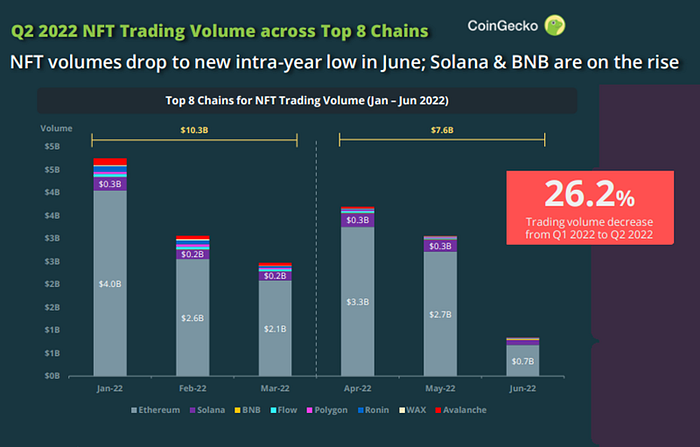
- Non-Fungible Tokens (NFTs) have plummeted in June to a meager $830 million — the lowest it’s been since June 2021, just before the boom. Overall, the NFT volume dropped by 26.2% in Q2.
- Ethereum is still the dominant chain in the NFT space, commanding 83% of the market share. The upcoming and the biggest contender right now to Ethereum in the NFT space is Solana.
- BNB was the only chain that saw an increase in volume (611%), thanks to STEPN’s move into the ecosystem. However, the Chinese ban on the latter might put a big dent in BNB’s numbers.
- Ronin continued its slip (-88%), with the bridge hack (a record $625 million) and a collapse in player revenue might be the final nail in its coffin.
- Meanwhile, OpenSea retained the top spot in NFT marketplaces. Nevertheless, Magic Eden and X2Y2 seemed to have caught up, taking turns to overtake OpenSea’s daily and even weekly volume in May & June.
Top 10 Crypto Exchanges
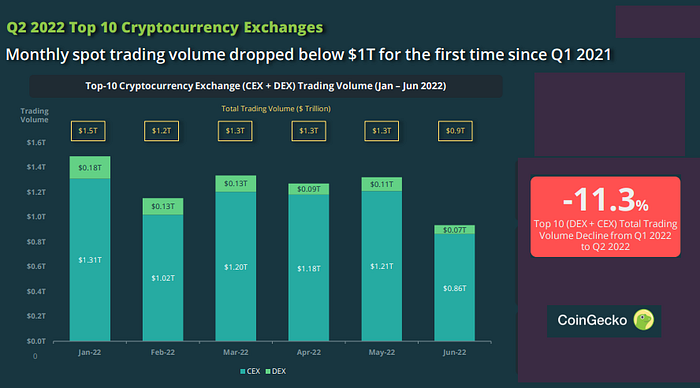
- Total trading volume in the Top 10 crypto exchanges (CEX + DEX) declined by 11.3% from Q1 2022 to Q2 2022.
- Q2 2022 monthly trading spot volumes were consolidating above $1T to $1.3T before finally breaking down to $0.9T in June 2022. This has not occurred since the beginning of the bull market at the start of 2021.
- The dominance of Centralized exchanges (CEX) remained steadfast, as the percentage increased from 88% to 92% in the second quarter. Decentralized exchanges struggle to make a larger footprint in the blockchain ecosystem.
- Top 10 CEX recorded a total of $3.25T in spot trading volume in Q2 2022 — a modest decline from Q1 2022, with June recording the lowest volume in the year so far. Both OKX and Crypto.com lost more than 50% of their market share in Q2 2022, while FTX has doubled its market share by the end of the second quarter.
- Trading volume in DEX dropped from $446 billion to $274.0 billion, from the first quarter to the second. Uniswap is still the dominant DEX with roughly 60% market share. However, Curve recorded the largest quarterly growth of 383%. Also, DEXs on Solana have either increased or maintained their share — pointing to market activity outside Ethereum gaining traction.
Notable Events Timeline
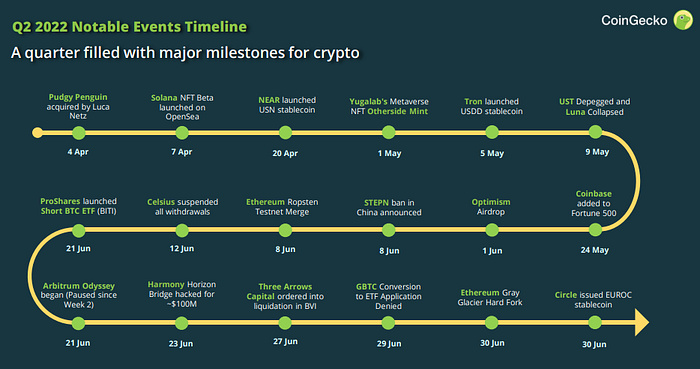
And finally, before I let you go, here’s a timeline of some of the noteworthy events that took place in the second quarter. Needless to say April to June was an eventful period. Solana launched its NFT beta on OpenSea, Ethereum Ropsten Testnet Merge happened, UST collapse rocked the markets, Coinbase was added to Fortune 500 companies, and a few others. The third quarter has started on a positive note and cryptos investors/traders are eyeing to see signs of thawing in this crypto winter.
Originally Published on Medium
Email | Twitter | LinkedIn | StockTwits | Telegram | Newsletter






