
Stabilizing at 25K–35K BTC inflows, Bitcoin’s price is likely to consolidate unless fresh momentum returns.
The cryptocurrency market's most closely watched metric has entered a period of moderation that could define Bitcoin's trajectory for the coming months. Bitcoin Exchange-traded fund (ETF) flows, which have become the primary driver of institutional Bitcoin adoption, are painting a picture of stabilization rather than explosive growth—a development that carries significant implications for price discovery and market dynamics.
Bitcoin is once again standing at a pivotal juncture—neither teetering on the edge of a breakdown nor poised for a dramatic breakout. The data, as visualized in the recent Ecoinometrics analysis, underscores a cooling in ETF flows that has tempered the market’s short-term trajectory. The macroeconomic situation and the Geopolitical developments are not helping the broader risk sentiment either.
ETF Flows: A Cooling Momentum
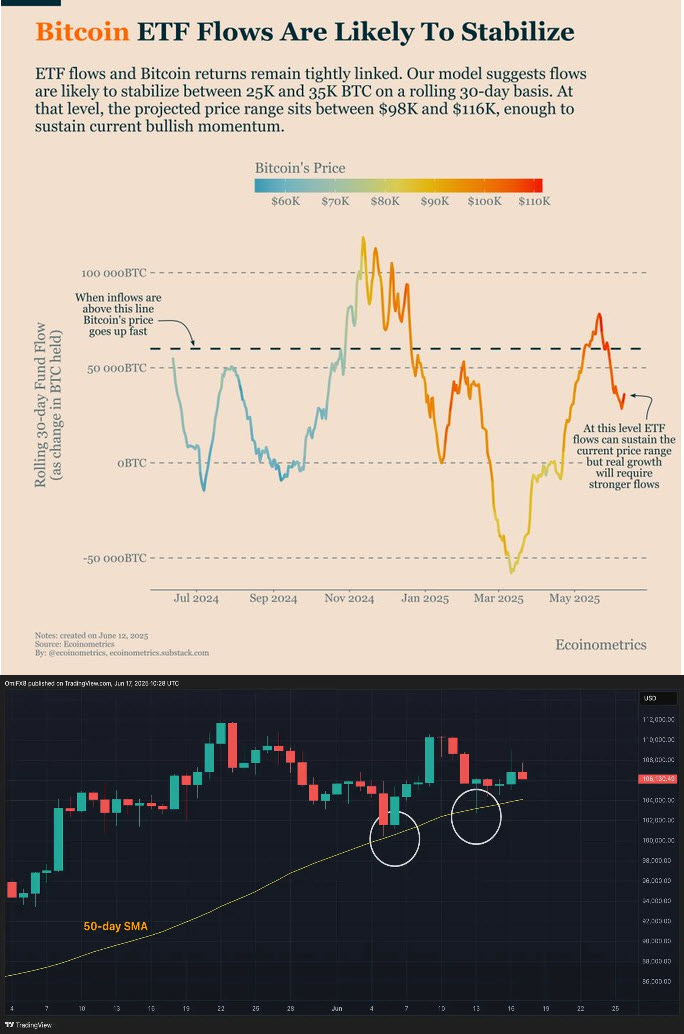
Ecoinometrics' rolling 30-day Bitcoin ETF flow model presents a sobering, though not bearish, reality. Over the past few months, ETF inflows have stabilized between 25,000 and 35,000 BTC, a considerable retreat from the 60,000 BTC threshold that historically catalyzes strong price momentum. This deceleration does not suggest an imminent downturn; rather, it points to consolidation, not acceleration.
Historically, when ETF inflows exceed the 50,000 BTC mark—particularly when moving past 60,000 BTC—Bitcoin’s price tends to rally sharply. This is due to the sheer scale of capital entering the space, amplifying buying pressure and reinforcing bullish sentiment. However, the current inflow range, though moderate, is sufficient to sustain bullish levels, just not escalate them.
The Price Range: Stability, Not Lift-Off
According to Ecoinometrics (chart below), ETF inflows at current levels support a Bitcoin price between $98,000 and $116,000. Bitcoin is presently trading within this band, which reflects a healthy consolidation zone rather than a precursor to decline. As of the time of writing, Bitcoin has fluctuated near $106,000, comfortably nestled in the mid-range of the supported price corridor.
This tight coupling between ETF inflows and Bitcoin’s market valuation reinforces how integral institutional demand remains to the asset’s overall momentum. The message is clear: Without a notable uptick in ETF flows, a breakout beyond $116,000 is unlikely. If the market is to push toward new all-time highs, it will need a fresh surge of demand—possibly through macro catalysts, regulatory breakthroughs, or simply a shift in investor appetite. Until then, expect more sideways action.
Technical Analysis: The 50-Day SMA as a Bullish Lifeline
Supporting the macro-flow narrative is the short-term technical picture. The lower chart illustrates a 50-day Simple Moving Average (SMA) that has acted as a reliable support level throughout June. Twice in the past few weeks, Bitcoin’s price has tested the SMA, only to bounce off with renewed buying interest—suggesting that traders still consider this level a valid accumulation point.
This moving average now serves as a psychological and technical floor. If Bitcoin continues to respect this level, it will likely remain in its current price corridor, slowly building strength. However, a break below the 50-day SMA could shift the narrative quickly. Such a move would likely trigger stop-loss orders, increase selling pressure, and possibly drag Bitcoin toward lower support levels near the $95,000 zone.
In this way, the 50-day SMA is not merely a line on a chart—it’s a dividing line between resilience and vulnerability in Bitcoin’s short-term market structure.
What This Means for Investors?
For long-term investors, the current phase of stabilization is far from negative. After all, consolidation within a high price range sets the stage for stronger future rallies—but only if supported by fundamentals like ETF flows and broader macro sentiment. Still, it’s important to distinguish between “not bearish” and “bullish.”
The lack of ETF inflow acceleration means that we are unlikely to see explosive upside until market participants begin allocating fresh capital again—particularly through regulated, institutional-friendly vehicles like spot ETFs. Here’s the key takeaway: The 60K BTC mark is the line in the sand.
If rolling 30-day ETF flows climb back to or above 60,000 BTC, history suggests that Bitcoin could enter another steep rally phase—possibly breaking past $120,000 and beyond. Until then, price action is likely to remain range-bound, tethered between institutional interest and broader market caution.
Don’t Mistake Calm for Weakness
Bitcoin’s current state is not one of indecision but of digestion. After a significant bull run earlier in the year, the market is absorbing gains, reassessing sentiment, and waiting for the next catalyst. ETF flows remain the leading indicator to watch, and the current 25K–35K BTC range is the eye of the storm—neither bullish fuel nor bearish threat.
For traders, this is a time to stay nimble. For long-term holders, it’s a moment of reaffirmation. And for analysts, it’s a reminder that in Bitcoin, flow drives force—and right now, the stream is steady, not surging.
Originally Published on Substack.


