Although the second quarter saw a broad continuation of the momentum, things slowed down in June
Doesn’t feel like it was only a year ago that the nascent decentralized finance started to make waves in the digital assets space. Compound is one of the pioneers in DeFi which provided a new mechanism for bootstrapping liquidity in DeFi protocols, earlier on. As the new players entered the DeFi market, the move coincided with the mainstream crypto boom. The rest is history.
Total value locked (TVL) in DeFi assets took an exponential trajectory as the TVL hit an all-time high on May 11 this year — just shy of $90 billion. The euphoria ever since has fizzled out as the current TVL stands close to $55 billion. Broadly speaking, Q2 2021 saw a continuation of this momentum. Having said that, the downturn in mainstream cryptos dragged down the DeFi market too, as activity decreased significantly.
With that in mind, let’s look at some of the charts to see how 2021 generally and Q2 specifically have shaped out for the DeFi market. The data was taken from Messari Research. The article aims at just providing a broad overview of the market. You can access the full report for detailed metrics.
DEX Returns
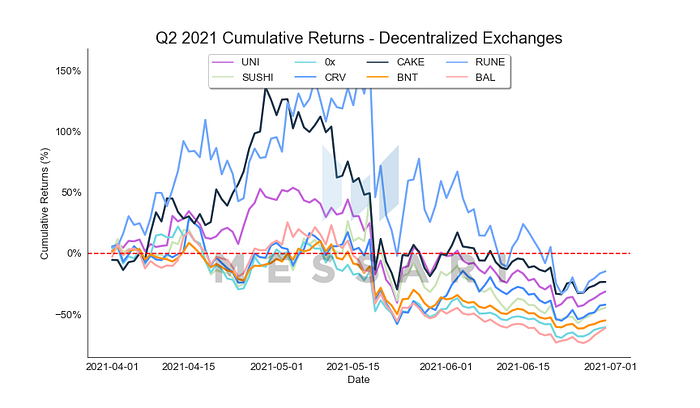
Figure 1
The chart above (Figure 1) provides a quarterly snapshot of the cumulative returns for the decentralized exchanges (DEXs). Q2 started along the flat line for most DEXs. As the market climbed to all-time highs, so did the cumulative returns — Uniswap was the biggest gainer followed by CAKE protocol. After the peak around mid-May, the grind lower started as most of the earlier returns vanished. The current picture shows a varying level of negative returns for most protocols. Bottom performers like Balance are down more than 50%.
DEX Volumes
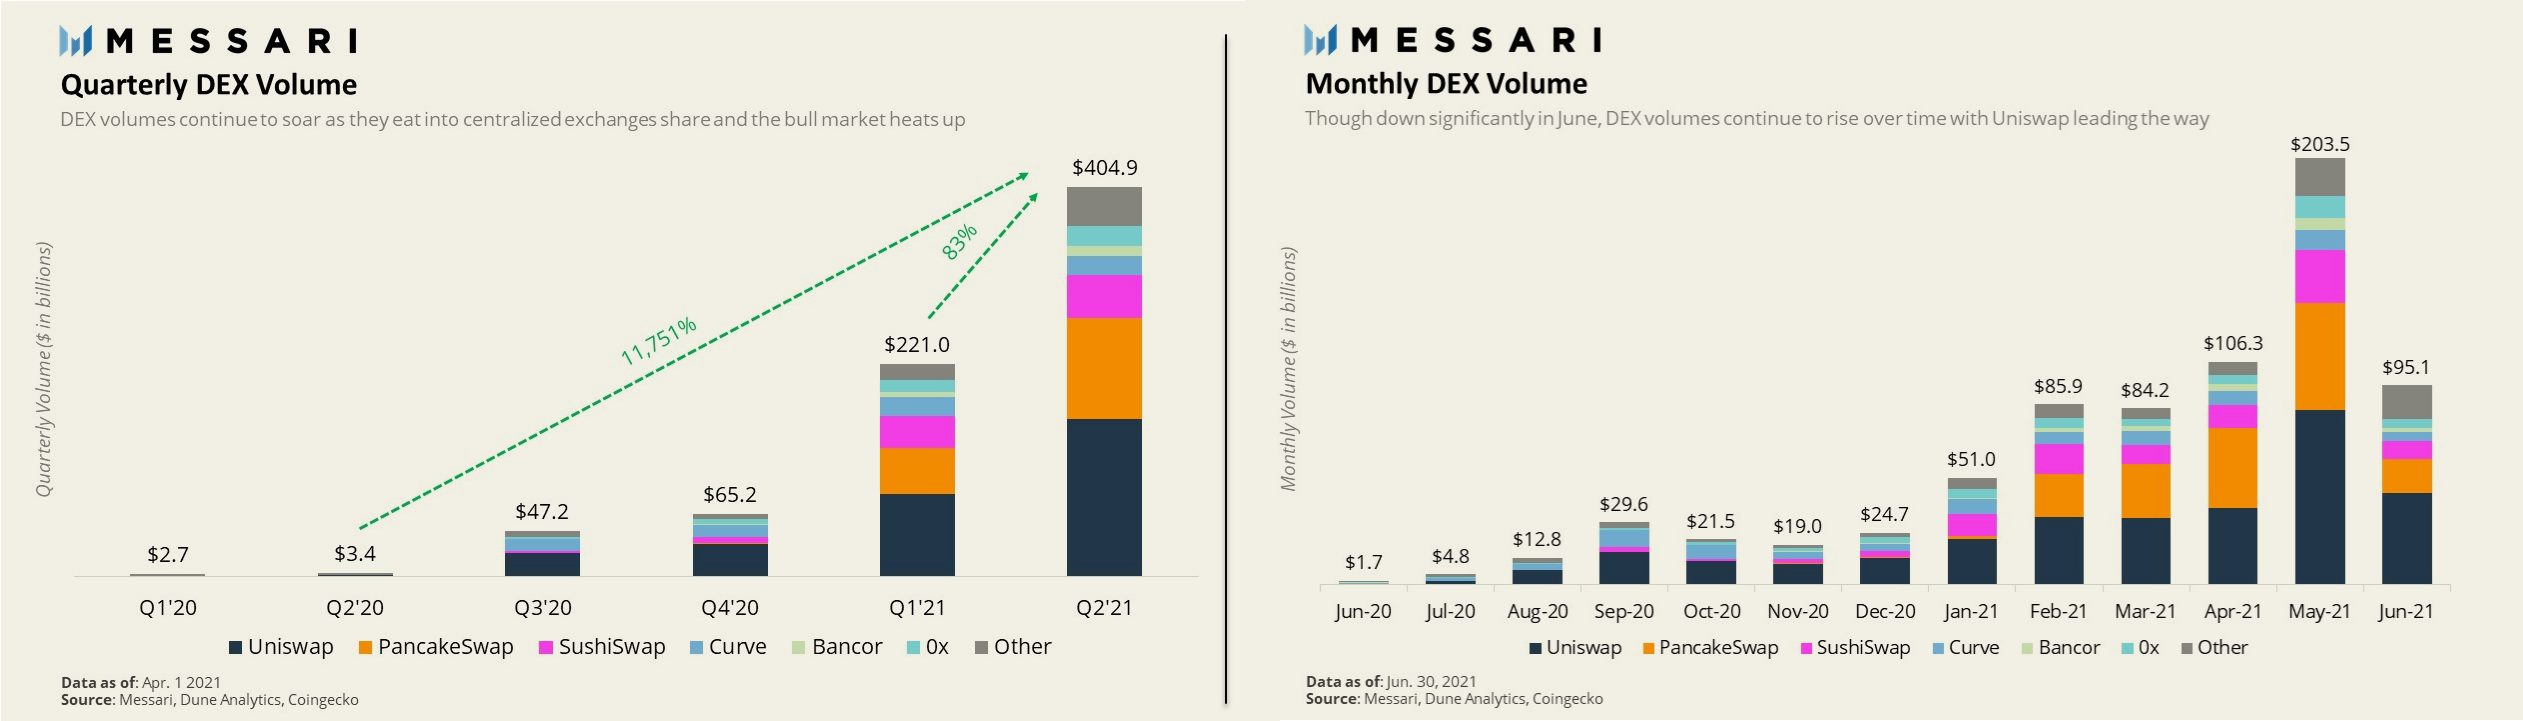
Figure 2
Visualizing the Quarterly & Monthly charts above (left & right respectively) present a little bit of a contrasting picture for the volume trends (Figure 2). As evident on the quarterly chart, going back all the way to Q1 2020, the DEX volumes have grown immensely — a massive 11,751% increase when comparing Q2 2020 to Q2 2021 & despite the slow down in June an 83% increase from Q1 to Q2 this year.
Looking at the monthly chart — since May, DEX volumes have halved, with June volumes falling to $95.1 billion. Still, the month was the third-highest all-time. Despite the monthly blip of June, the overall bigger trend of growth continues to manifest itself. It remains to be seen whether we are looking at a prolonged downtrend or a short-term correction.
Analyzing the competitive landscape, we see a pretty dramatic shift in PancakeSwap’s standing. According to the data for a brief moment in April, the breakfast-themed DEX flipped Uniswap in volumes, since then its market share has plummeted due to the rise of Uniswap V3 and the fizzling out of the Binance Smart Chain Ecosystem, following the May crash.
DEX Market Share

Figure 3
Further analysis of DEX market share in terms of volume (Figure 3) finds Uniswap gaining momentum lately after consistently scoring around 40% of the market share for the most part of this year (left chart above). By the end of the quarter, Uniswap reached a 54% share of weekly volume, its highest level since November 2020. It appears that both Uniswap & Pancakeswap have eaten into the share of Sushiswap. The activity provides a great glimpse into the developing liquidity wars between blockchains.
Looking at the other side (right chart above), highlights the rise of Polygon. The rise of Polygon played a significant role in eating away Binance Smart Chain’s (BSC) share of decentralized exchange volumes. As the party shifted towards Polygon, with its new set of tokens to speculate on and farms to harvest, BSC was squeezed out of the picture. Lately, however, BSC has again started to gain traction.
DEX vs. CEX
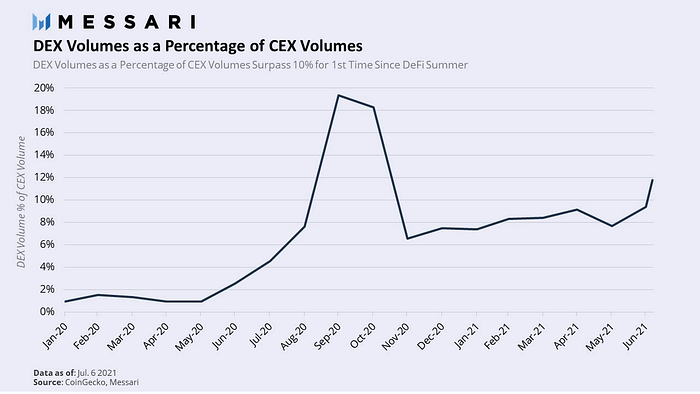
Figure 4
And finally, looking at the bigger pictures for decentralized exchanges volumes as a percentage of centralized exchange (CEX) volumes surpassed 10% for the first time since October 2020 (Figure 4). The data supports the narrative that DEXs are slowly taking over the centralized contemporaries. This infringement is well supported by the recent launch of Uniswap’s highly anticipated Uniswap V3 protocol, with its crown feature of concentrated liquidity.
The design promises to increase capital efficiency for liquidity providers (LPs) by as much as 4,000x by enabling LPs to provide the same liquidity depth as V2 within specified price ranges while leaving far less capital sitting idly. Within just weeks it became the top DEX in the industry and in June it facilitated nearly $28 billion in volume.
Originally Published on Medium
Email 📭| Twitter 📜 | LinkedIn 📑| StockTwits 📉 | Telegram 🔗 | Facebook 📘


