
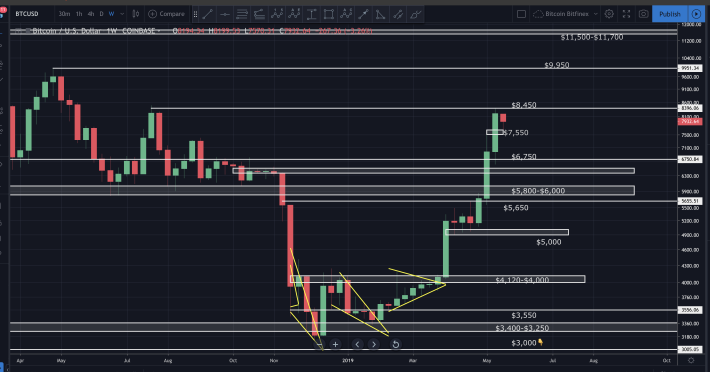
Bitcoin has held above $7,500 for 3 days now. We’re starting to see price get squeezed with lower highs and higher lows. It looks like we may see a larger move in the next 3-6 days. The weekly chart looks extremely extended. A decisive break below $7,500, could usher in a the larger correction many are waiting for.
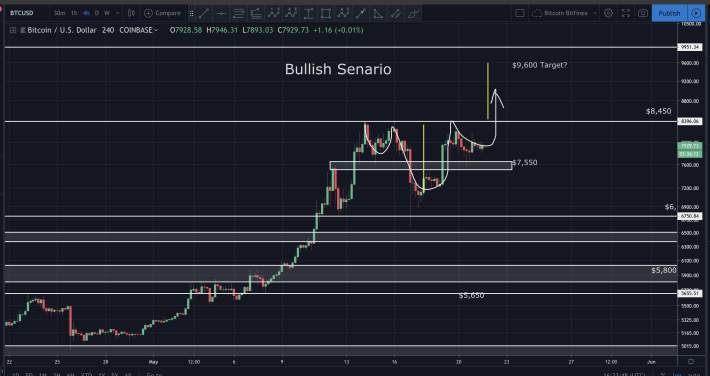
Zooming in on the 4 hour chart, things are a little less clear. I can certainly make an argument for a short term break above the prior swing high. In addition to a tightening range (which could break either way), we’re starting to see a possible inverse head and shoulders pop up on the smaller time frames. This has not been validated yet. If it is validated, price would have a target of approximately $9,600.
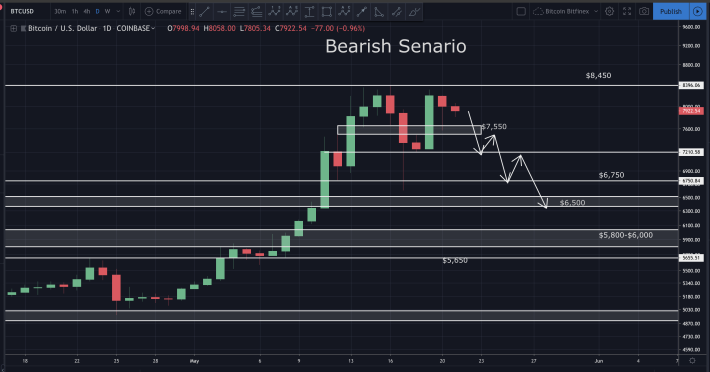
A decisive break below $7,500, could usher in a drop to at least $6,500. I wouldn’t expect a free fall, but rather a more structured correction that looks something like the following.
In today’s video I analyze Bitcoin, EOS, LTC, ETH, BNB, BAT and XRP. I’ll discuss the bullish and bearish case for each, price targets, traps to avoid and so much more. I hope you find it helpful.
Video Analysis:
I hope this has been helpful. I’d be happy to answer any questions in the comment section below. Until next time, wishing you safe and profitable trading.
Workin
Disclaimer: This is NOT financial advice.
Open a free account on Binance here:
https://www.binance.com/?ref=16878853
Get paid for viewing ads and Support the Crypto Ecosystem with Brave Browser. Free download here:
https://brave.com/wor485
YouTube: https://www.youtube.com/channel/UCJqGczdWE99ORopJ5ZUDauA
Twitter: https://twitter.com/workin2005
Facebook: https://www.facebook.com/Workin2005
Feature Image By: Saul Gravy


