
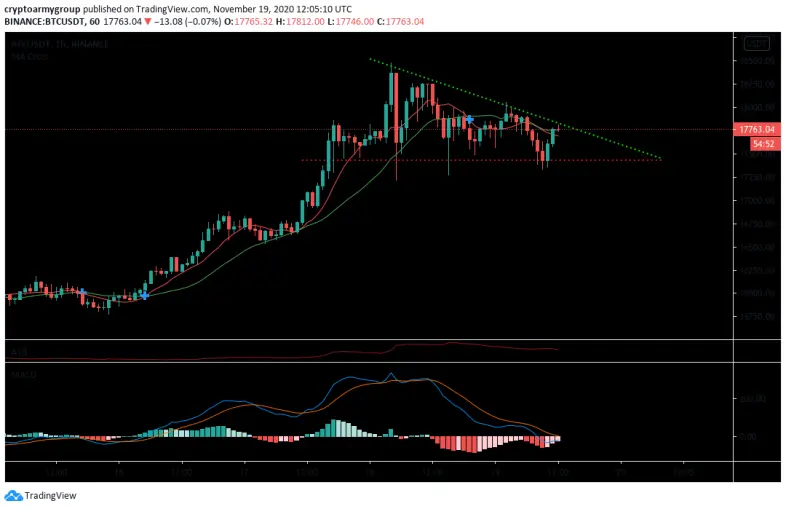
Yesterday, Bitcoin formed a Diamond Top Pattern that pulled us back to trading in a range of 17400-17700$. On the daily chart, we can observe that the uptrend of BTC is still intact, but on 4 hours and 1 hour chart, Bitcoin is trading in a triangle showing crucial levels that BTC must hold before the next move.
In the chart below you can observe the triangle, in which we mark the short-term support level of 17343$, closing a 4 hour candle below these levels is not a good indicator, and we may see a pullback to range between 16800-17200.
Otherwise, breaking the resistance levels and close a 4 hour candle above 17860$ is a short-term indicator of a continuation in the pump scenario to reach 18000$ levels again.
On daily chart, closing a daily candle above 17500$ levels is a bullish indicator. And as you can see in the previous image, the selling volume of Bitcoin is starting to decrease recently, but the volatility of the price action is increasing.
Always remember that the trend is your friend, this is not a financial advice, do your own research and trade wisely.
Thanks for your attention, we would appreciate a like, a comment suggesting the next coin to provide you with the latest analysis and a follow.
Crypto Army





