
In this article we are going to discuss the recent move of Bitcoin. Bitcoin suffered almost 8.5% dump in few hours. But based on technical analysis we are going to show for the viewers the possibility of going back up to previous levels and all the possible scenarios. Please remember that this is not a financial advice, please do your own research and trade wisely.
On the 8th of December, the MACD indicator turned bearish on 1 hour chart around 6:00 A.M UCT, and since then the price started to dump hardly, with intervals of small corrections before the continuation of the trend.
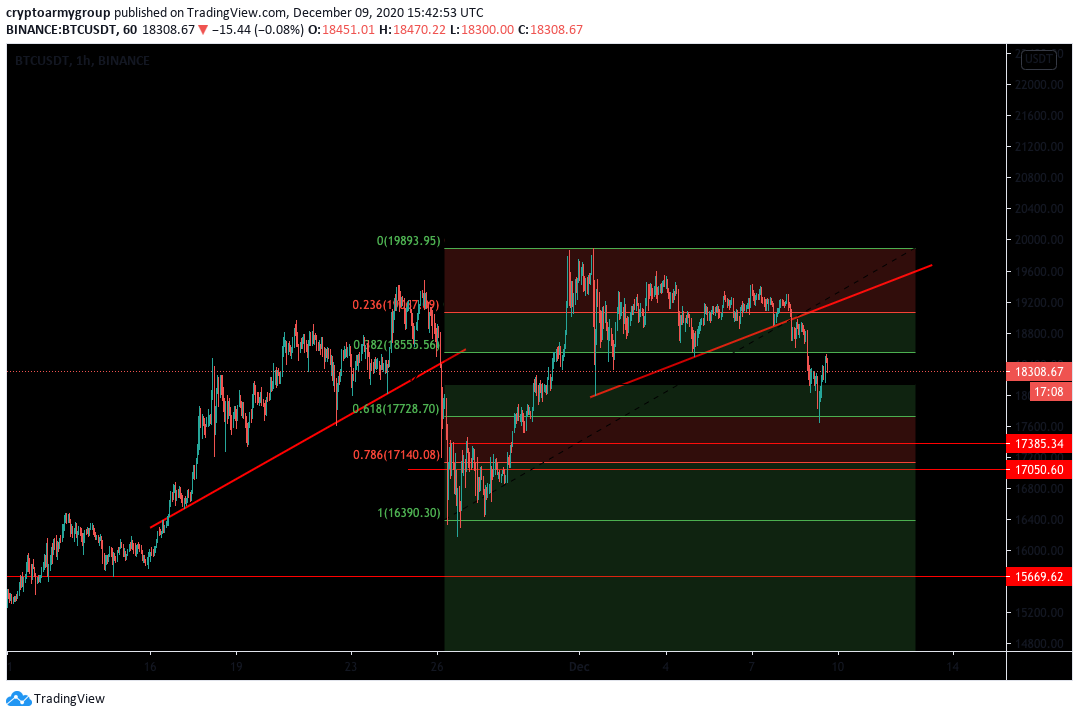
In the image below you can observe that since Bitcoin fell below the trend line before forming the ascending triangle. Bitcoin dropped almost 8.5%, but if you observe the latest pump of Bitcoin since 16445$, the recent correction can be examined on the Fibonacci Retracement tool. On Fib numbers you can observe that Bitcoin only reached 0.618 levels, held this levels and came back up.
Current Price: 18331$
MACD indicator on 1 hour chart : Bullish
Support lines: 1. 0.618 on Fibonacci Retracement : 17727$
2. 17328$ based on previous resistance level before breakout.
3. 16388$
4. 15669$ based on previous resistance levels.
Resistance Levels: 1. 18551$
2. 19066$
3. 19900$
This was a brief technical analysis for Bitcoin, for this moment it is important to watch 0.618 levels. Please trade wisely during high volatility.
We would appreciate a like, comment, follow and a tip.
Thanks for your attention,
Crypto Army


