
The triple bottom and triple top are price chart patterns that indicate a potential downward or upward trend reversal, respectively. These patterns are considered important technical signals by technical analysts, traders and investors.
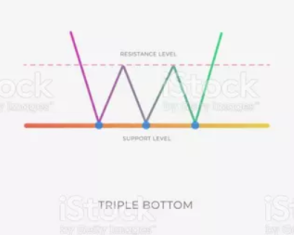
Triple Bottom:
The triple bottom is a price chart pattern that forms when an asset reaches a key support level three times and rebounds each time. It is considered a technical signal of a potential downtrend reversal, as it indicates that buyers are overtaking sellers and that the downtrend may be about to end. The three lows should be relatively equal in level and duration, and it is important to watch the trading volume when forming the pattern, as high volume can indicate confirmation of the potential trend reversal.
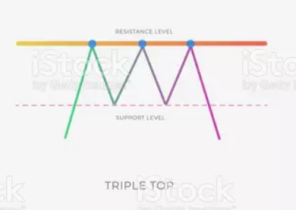
Triple Top:
The triple top is the opposite of the triple bottom, it is a price chart pattern that forms when an asset hits a key resistance level three times and bounces back each time. It is considered a technical signal of a potential uptrend reversal, as it indicates that sellers are overtaking buyers and that the uptrend may be about to end. The three peaks should be relatively equal in level and duration, and it is important to watch the trading volume when forming the pattern, as high volume can indicate confirmation of the potential trend reversal.
Key points to remember:- The triple bottom and triple top are price chart patterns that indicate a potential downward or upward trend reversal, respectively.
- The triple bottom occurs when an asset reaches a key support level three times and rebounds each time.
- A triple top occurs when an asset reaches a key resistance level three times and rebounds each time.
- The three lows or three highs should be relatively equal in level and duration.
- It is important to watch the trading volume when forming the pattern, as high volume can indicate confirmation of a potential trend reversal.
Basic rules of money management:
Have a risk/reward ratio of at least 2:1 for each position taken in trading. This means that the potential gain should be twice as large as the potential loss.
Risk no more than 1% of your capital on each position taken in trading. This limits potential losses and protects trading capital.
Use a stop loss to limit potential losses and a take profit to set profit targets.
Avoid taking too many positions at once and diversify the trading portfolio to limit risk.
By following these basic money management rules, traders can effectively manage the risks associated with Bull Flag and Bear Flag trading and maximize their potential gains. It is important to follow these rules strictly to minimize the risks associated with taking positions.


