
Supports and resistances are key concepts in technical analysis that help traders identify important price levels on the price charts of a financial asset. These levels can serve as entry and exit points for trading positions.
A support is a price level below which it is difficult for the price of an asset to fall. This may be due to strong demand for the asset at that price level, which attracts buyers and prevents the price from falling further. Supports are often represented by a horizontal line on a price chart.
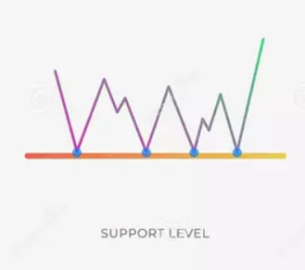
A trader can use a support to buy an asset as the price approaches that level. This can be an effective strategy because the support can act as a rebound point, which can push the price higher. If the price falls below the support, it may indicate a weakening uptrend and may prompt traders to take short positions.
Resistance, on the other hand, is a price level above which it is difficult for the price of an asset to rise. This can be due to a strong supply of the asset at that price level, which attracts sellers and prevents the price from rising further. Resistances are also often represented by a horizontal line on a price chart.
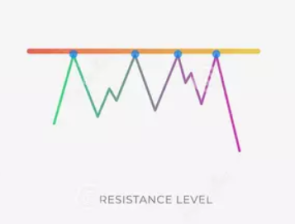
A trader can use a resistance to sell an asset as the price approaches that level. This can be an effective strategy because the resistance can act as a turning point, which can push the price lower. If the price breaks above the resistance, it may indicate a strengthening of the uptrend and may prompt traders to take long positions.
Support and resistance can also be used together to determine a trading range, where the price of the asset moves between the two levels. Traders can buy the asset near the support and sell near the resistance until the price moves out of the trading range.
It is important to note that support and resistance are not fixed levels and can change over time depending on market conditions. Traders should therefore be aware of changes in support and resistance levels to make informed trading decisions.


