
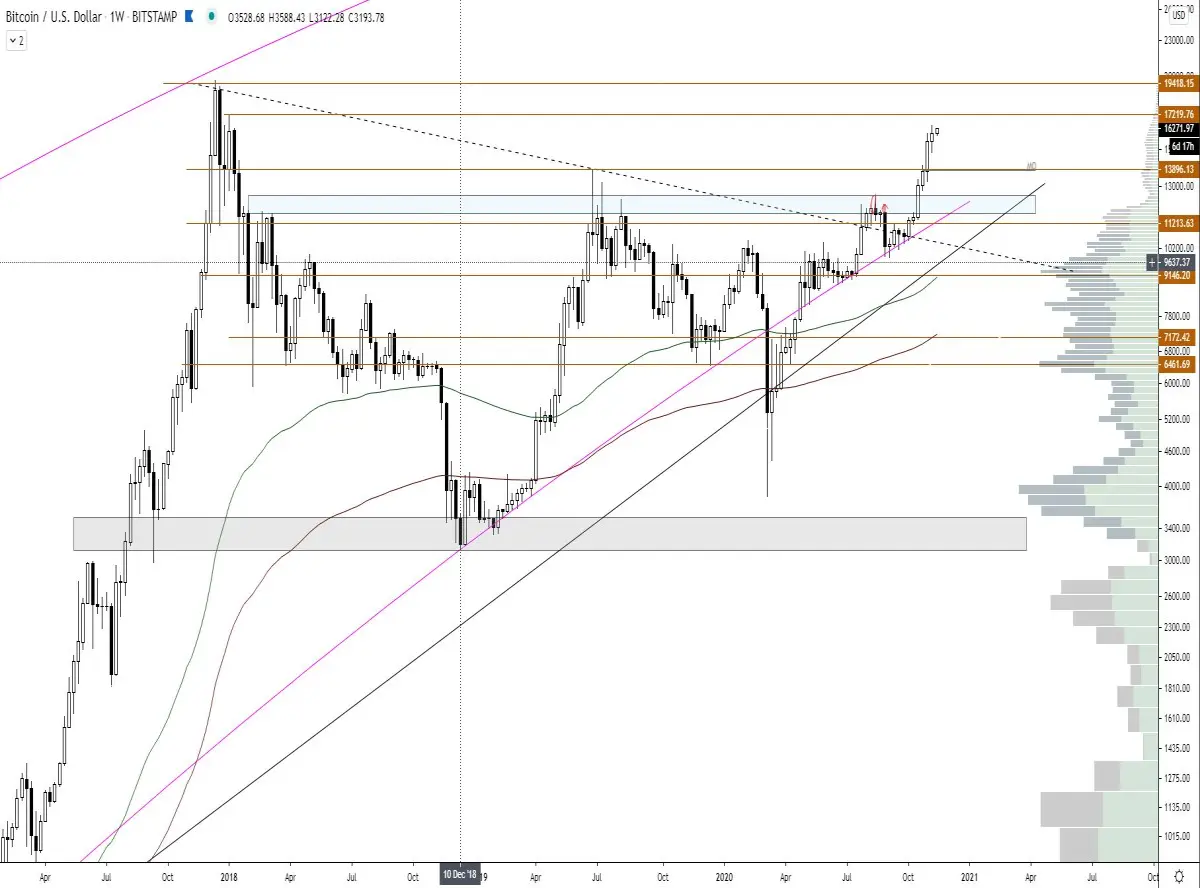
Bitcoin keeps on ramming and for the 6th week in a row she managed to put down a beautiful green candle. On the weekly chart we can't help but be bullish. We are now in the resistance range that runs up to 17.2K. Are we going to see a retrace from there or can we just go on. This week we will take you with us in my vision on the Bitcoin course.
➡️ Join our free crypto Discord server and come talk about crypto charts
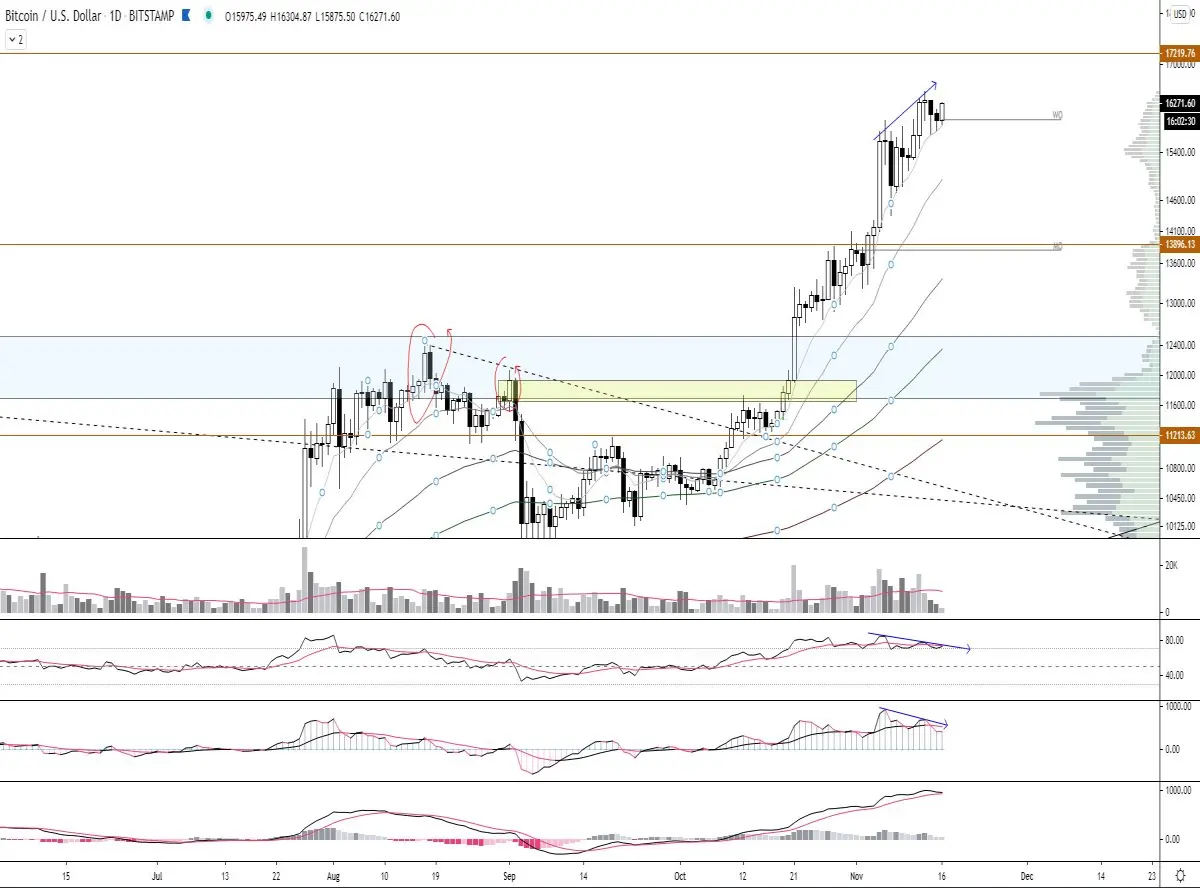
The daily also feels like it and keeps on rising. We see a single red candle to catch our breath for a while and then go up again. We see that there is a bear div on both the rsi and the lbr, but I seriously wonder if it is going to play or if BTC is just fooling around with the divergence. We see that Bitcoin has ignored it more than once in the last period. Around 14K we also had a nice div and a retrace to the previous highs would be in line with a golden pocket retrace. However, the retrace was never there.
Looking at the indicators we see a lot of bullish momentum on the ema's and although there is a divergence on the rsi, it keeps strongly above the middle line and occasionally changes position with the ema. The rsi is now also against the ema and the trend line which also shows the divergence. When both of these lines cross upwards the divergence is immediately no longer legit! The divergence on the lbr will probably still be there but we also see that there is still enough bullish momentum.
Last weekend we were able to see a resistance to support flip which manages to stand up well. But here we only flipped horizontally to support but also the earlier oblique resistance line and in this way we actually see an upbeat channel form. Other people saw a bear div come into being on the 4 hour chart but I did not agree with this and I certainly did not short it. The divergence is drawn over a period of 42 candles. The rsi is based on 14 candles so you would like to spot a divergence in those 14 candles as well. In my opinion you can deviate a bit but from 14 to 42 I really think it's too much. I keep 21 candles as the max for a divergence.
We've put a higher lows on the red zone and now we have to put a higher one in order to continue the trend, which I don't think is a problem at all. The rsi is above the ema again and also moves above the midline. We do see a trend line that can resist. For the lbr it looks almost identical to the rsi and the macd seems to follow. When all three of them do the same, there is a very good chance that it will play, 3x is the right thing to do. 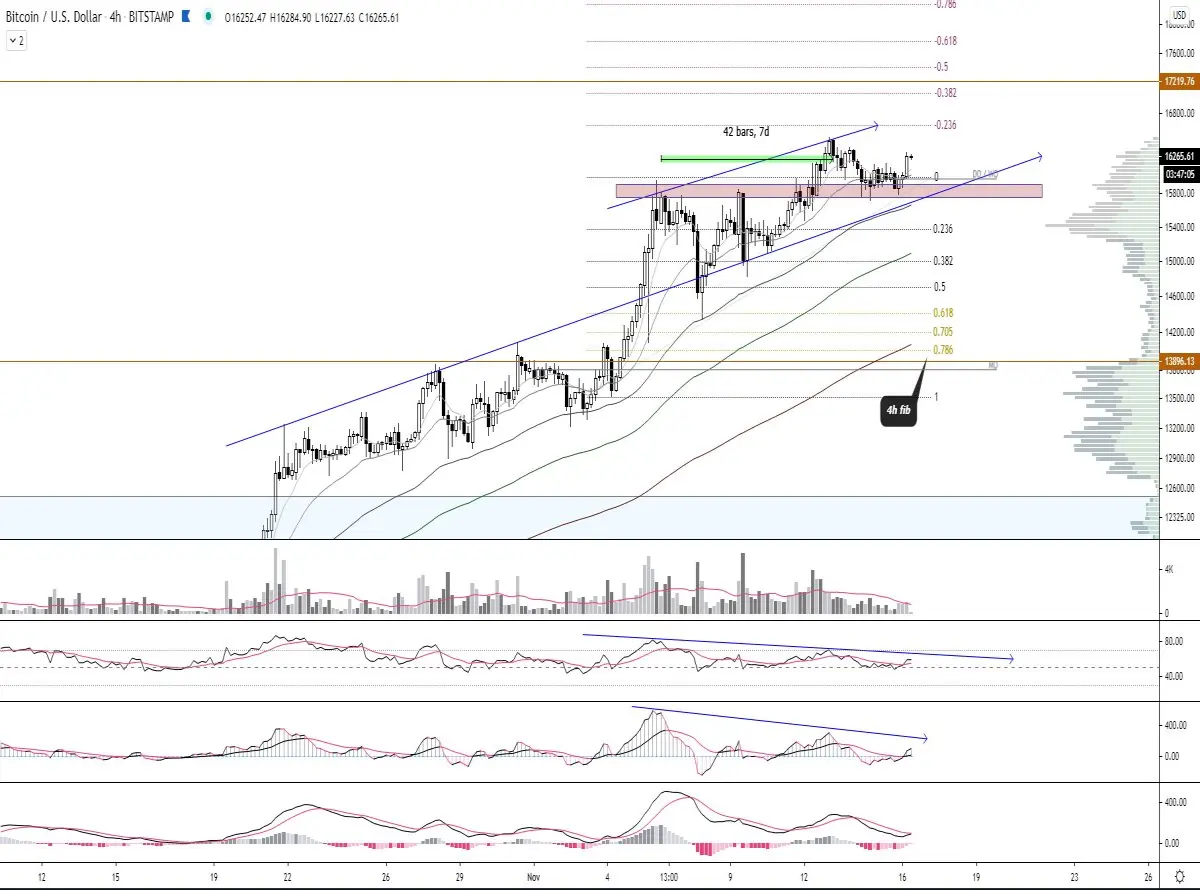
Conclusion: I am still bullish on Bitcoin. Resistance will be around 17.2K and local support will be at 15.8K. If we lose the 15.8K then in my opinion it can go fast towards the 14K. But personally I think we are going to visit the 17K before there is a retrace (if it comes at all).
➡️ Join our free crypto Discord server and come talk about crypto charts






