
About a month ago, at the request of the community, we analyzed LINK. Today we are going to take a look at the current state of affairs for LINK. The green zone which has confluence with the weekly golden pocket has been able to hold its own and the course has started to slowly rise. As we can see on this chart it is likely that the higs of August 2020 will be tested. The rsi is on the crook side of the neutral zone and has been going up for several weeks and the ema is moving in the opposite direction and is about to cross bullish or bearish. For the lbr is the same as what we can see on the rsi. We also see the bullish momentum increasing on the lbr.
➡️ Join our free crypto Discord server and come talk about crypto charts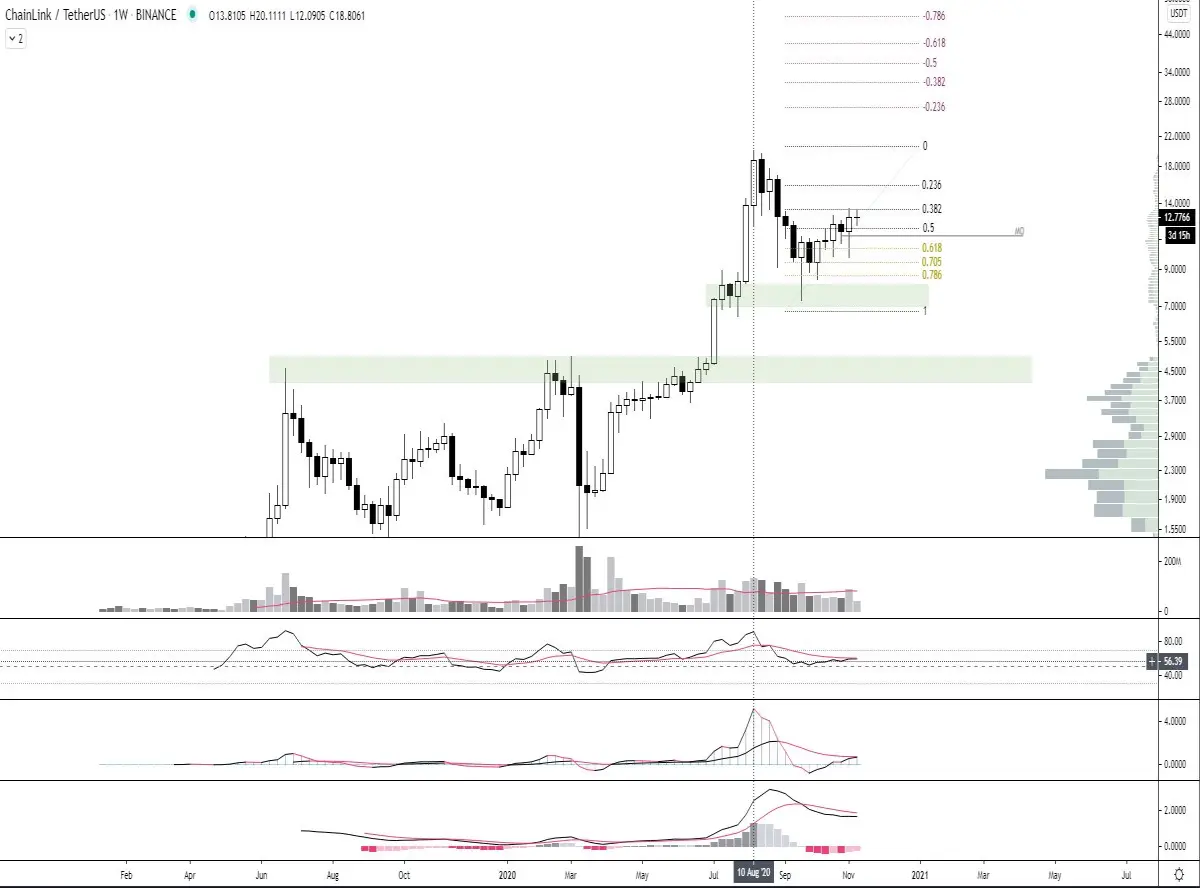
As many will already know, I don't like to trade patterns but rather horizontals. I always draw them and take them into account. After all, they are legit patterns on which a lot is traded. On the daily ChainLink is currently in a rising wedge and is experiencing resistance from the upper trend line, and the red resistance zone. There is also a bear divergence on the rsi like the lbr. On the macd it has not been able to form so there is a small chance that it will not play. We often see that if they first form on the rsi, then the lbr and finally on the macd, there is a very good chance that it will play.
The rsi seems to want to go up again at the moment should be above the red line to make the divergence not valid. The lbr is still descending but we do see bullish momentum. Furthermore the ema's are in a good mood for the bulls. The ema8 and 21 have tested the ema55 and are beautifull bounced with an increase of 22% as a result. The ema's are fairly apart, the bullish momentum is present.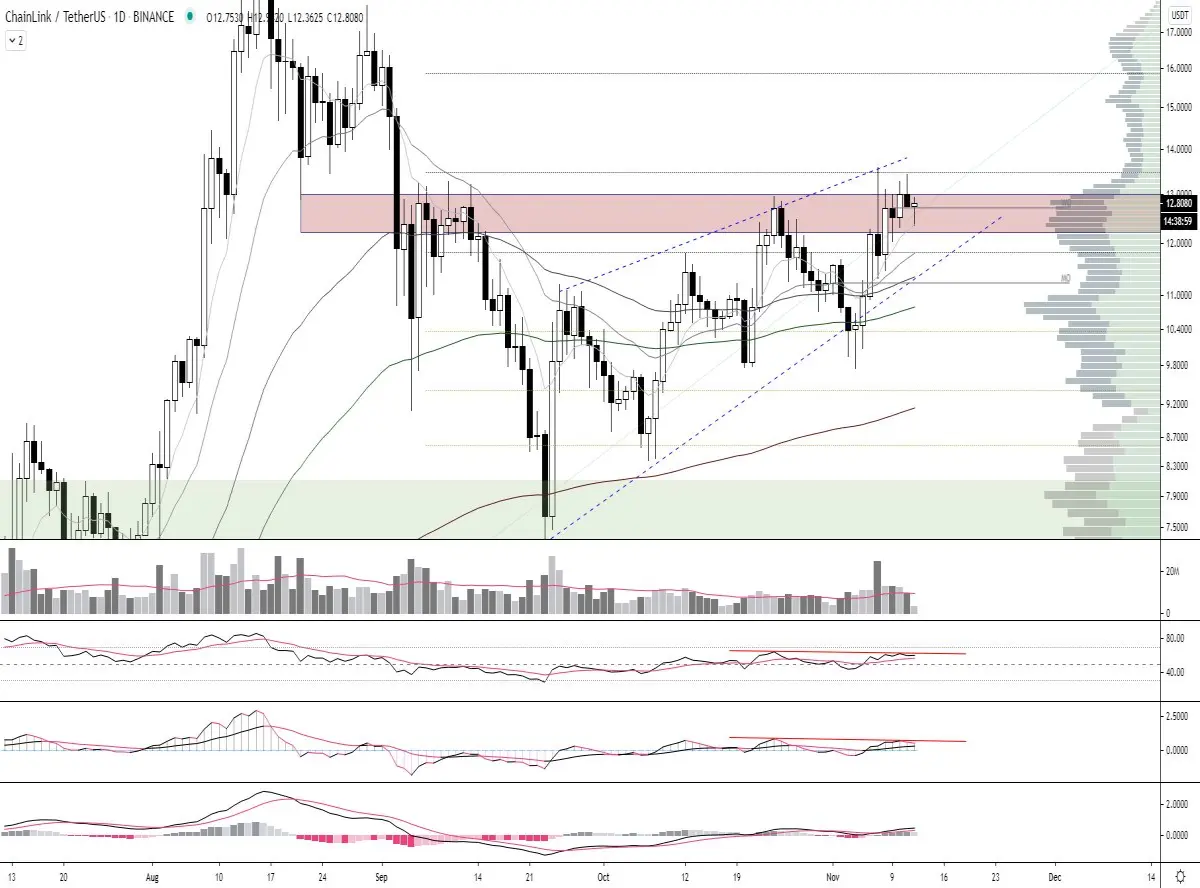
Here the bulls seem to get a bit exhausted. LINK still puts down higer lows for the time being but the high breaking has not yet succeeded. The bullish momentum is decreasing on the short ema's and the lbr indicator. The three longer ema's are still fine for the bulls and there is still enough bullish momentum to be found. The rsi and the lbr both have difficulty to really stand above the middle line and both experience resistance from the ema and signal line. On the macd the bearish momentum starts to increase and we also see the emacd line moving down, well above the 0 point. 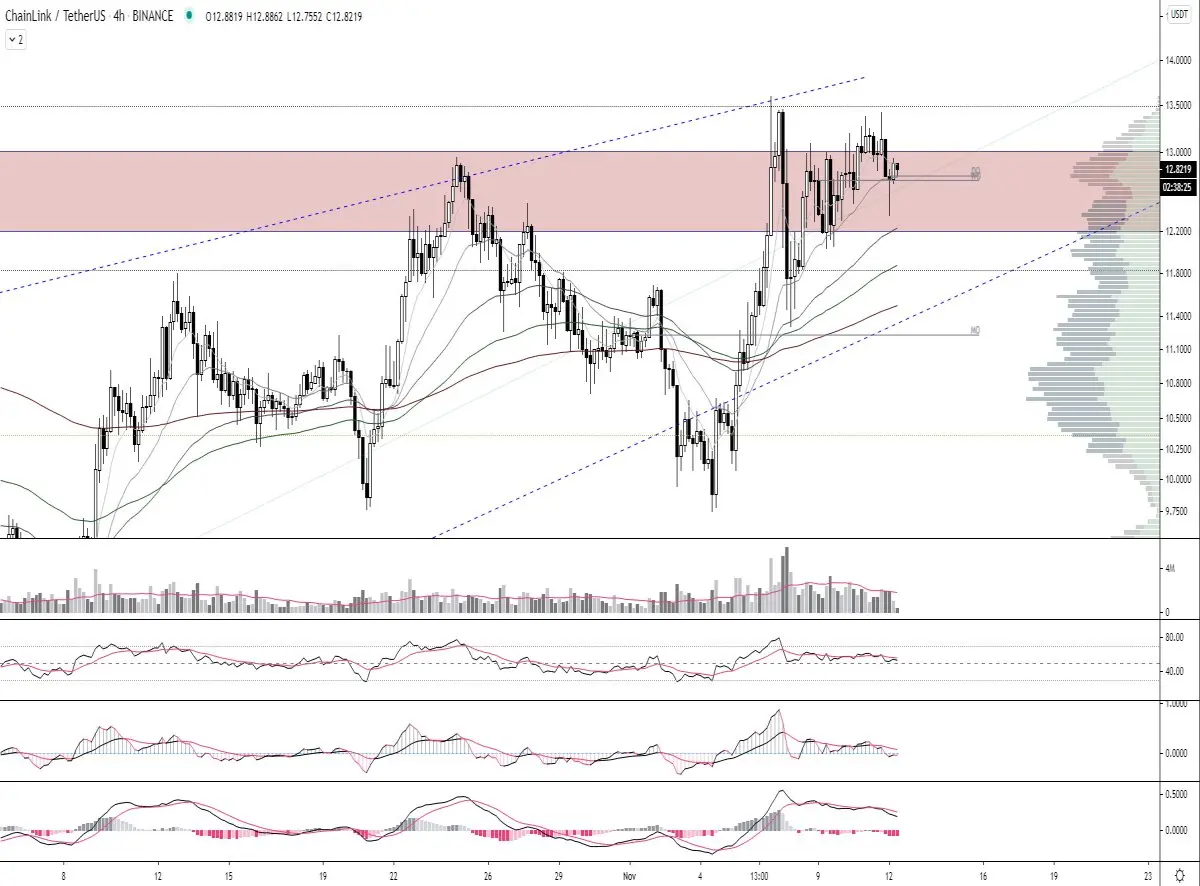
Conclusion:
$11.59 is the support level you need to keep an eye on. If the price falls through it, the lower trend line of the rising wedge will be broken. This can be a fakeout as we have seen before but the most logishe will be a bearih retest with the following resistance underneath around $8.60. If the bulls can flip the red zone in support on the higher timeframes then we can look at the next resistance around $16.46 and on top of that at $19.28.
➡️ Join our free crypto Discord server and come talk about crypto charts






