
Litecoin has reached the resistance level at $139 as we discussed in the analysis two weeks ago. High time to pick up the charts again. On the weekly chart the exchange rate is currently between 114 - 139 dollars. The ema's are still in bear mode but are crawling up and closer together. For more detailed information we will zoom in. 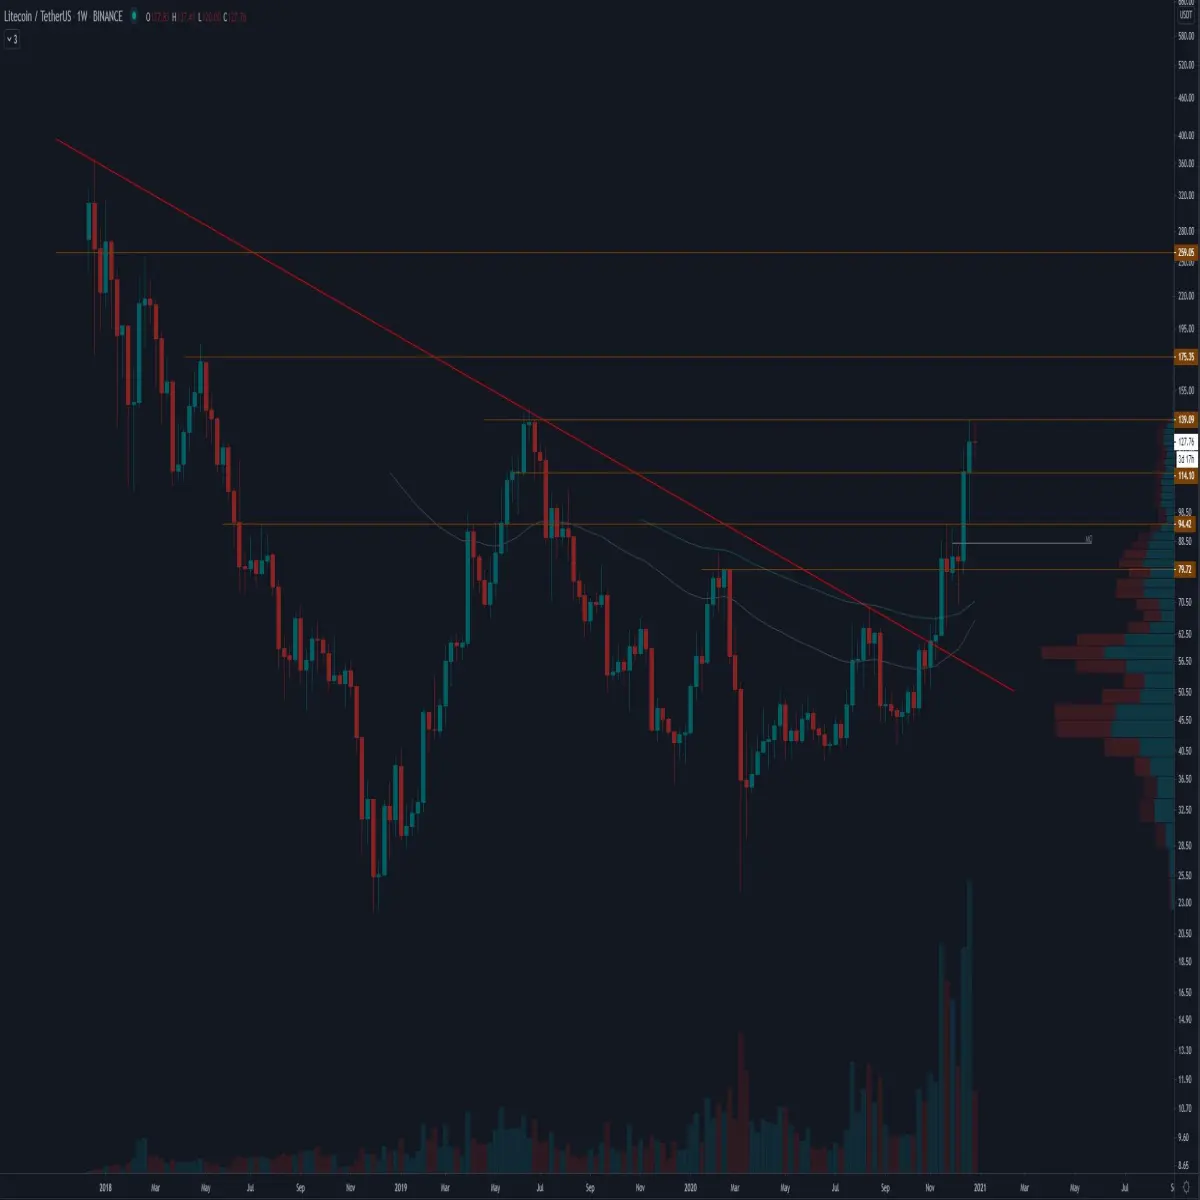
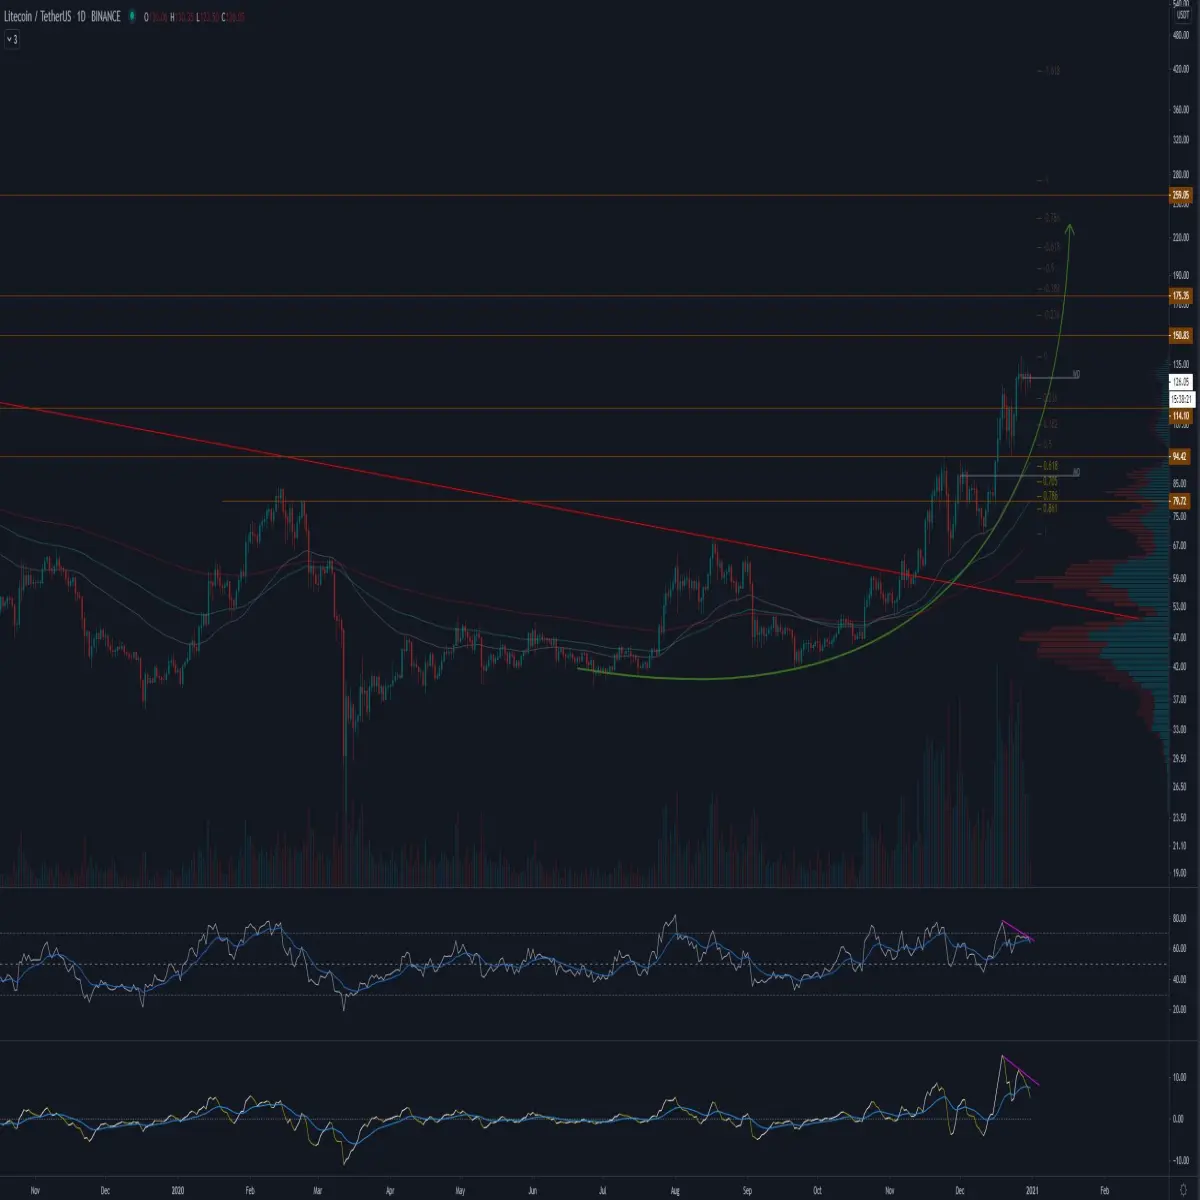
On the day graph we see a beautiful parabolic move. On the last two peaks we do see a bear div form both on the rsi and the lbr. The rate has also been struggling to break the resistance level of $139 and is moving in a tight straight line underneath all week.
If we pull the weekly Fibonacci over the chart, we see that the golden pocket has confluence with the ema's 55 and 100. This would also be the scenario that fits the rising wedge.
On the 4 hour graph Litecoin is in a bull flag which is diametrically opposed to our earlier findings. The rsi is also still experiencing resistance from the trend line. The bottoms of the rsi are the same but at the lbr we can already see them rising. The ema's remain favourable for the bulls.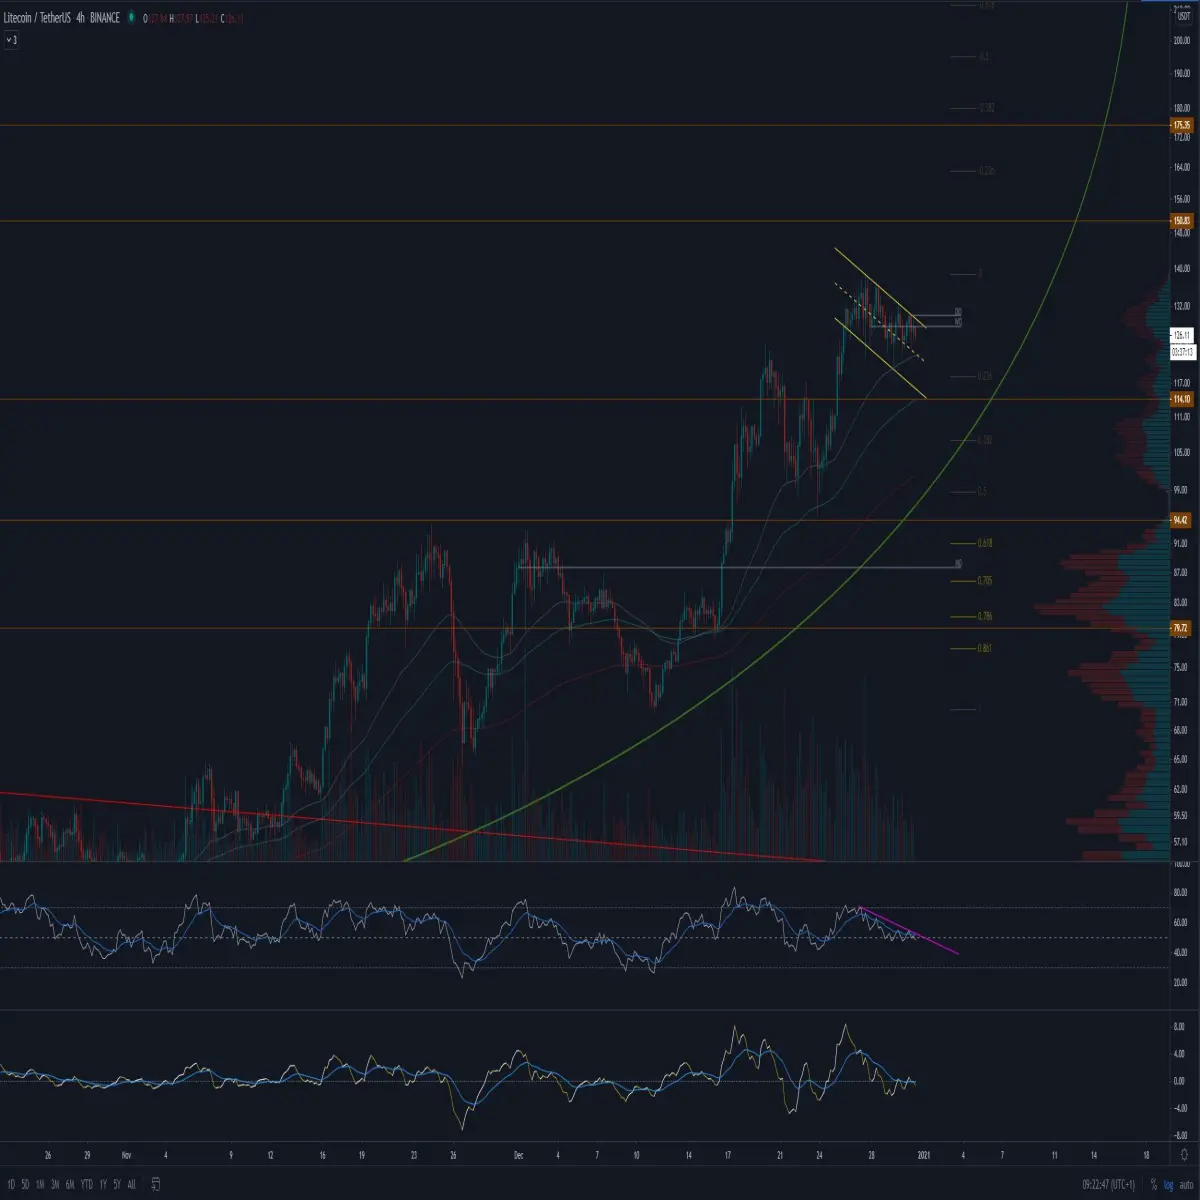
Conclusion:
Depending on how Litecoin will play the bull flag on the 4h, the following scenarios are possible. When the bull flag breaks upwards, with a bit of luck the 139 will be broken. You will want to see this at least on the 4h tested again. The next resistance is 175 dollars.
The daily bear div should also be watched as it could push the price towards the weekly Fib 0.382 (107 - 114 dollars) which would also be a test on the parabolic trend line. If there is too little bull power to continue the rise we would encounter the first support zone at $95. However, there is a big chance that lower lows will be printed and the drop will continue towards the 79 dollar.
Also, If you are interested in trading, I would suggest you try out Coingrats free Discord server where we discuss the market and share interesting content. We have also have a free premium section where we share trading signals for Bybit. More info in our Discord server






