We will start this week on the daily chart as there is little new information on the weekly. On the daily chart we still see a higher low and a higher high, although the latter is decreasing in strength. We also see a bear div formed on the three indicators and we also see the bearish momentum increasing slightly.
The last inpulse wave measured with the Fibonacci we see a golden pocket just above the horizontal support level (orange). A retrace to this ($500 - $530) won't be so crazy. If that happens you should also take into account that the price for a short period of time also goes a bit deeper to get liquidity under the wick where the 1 level of the Fibonacci is and the ema100 is going to be tested. Here is also confluence with the red support zone and the trend line (blue).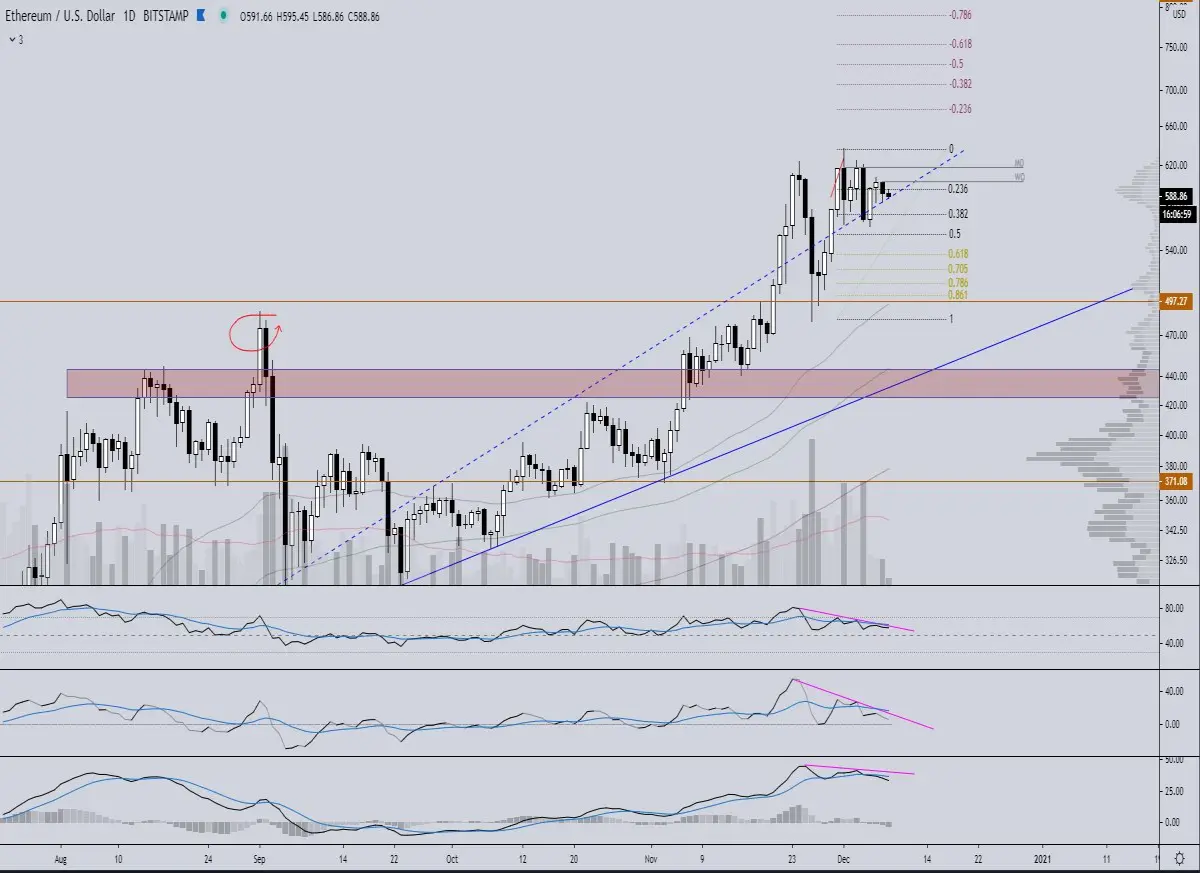
Here we see that a double top was formed (purple) after which the price almost immediately looked up the low and high in red. With the falling trend line at the top this can form a decending triangle with just a little more chance of an outbreak at the bottom.
On the VPVR you can clearly see that there is quite a bit of resistance at the level that is currently being traded. Below that there is quite a gap to the Fibonacci levels 0.786 and 0.861. Around the 0.618 we also see a spike support but it will be skipped as it seems.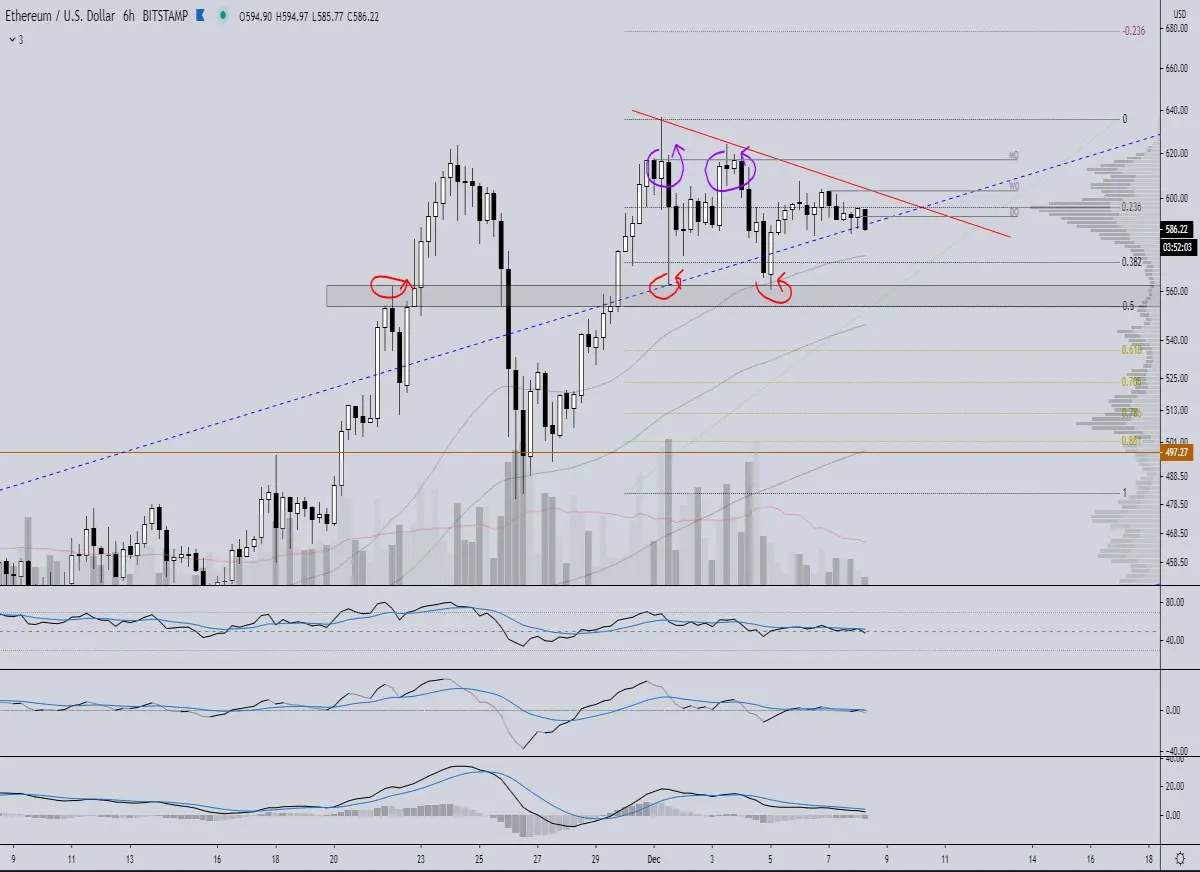
On the lower timeframe we also see a decending triangle where the local support has just been tested. The ema55 and ema100 are bearishly crossed and also on the rsi, lbr and macd we see that the bulls are struggling with it.
On the VPVR we see a bit better than on the 4h that there is quite a bit of weather city above the course of ETH and below us quite a hole without any kind of support. 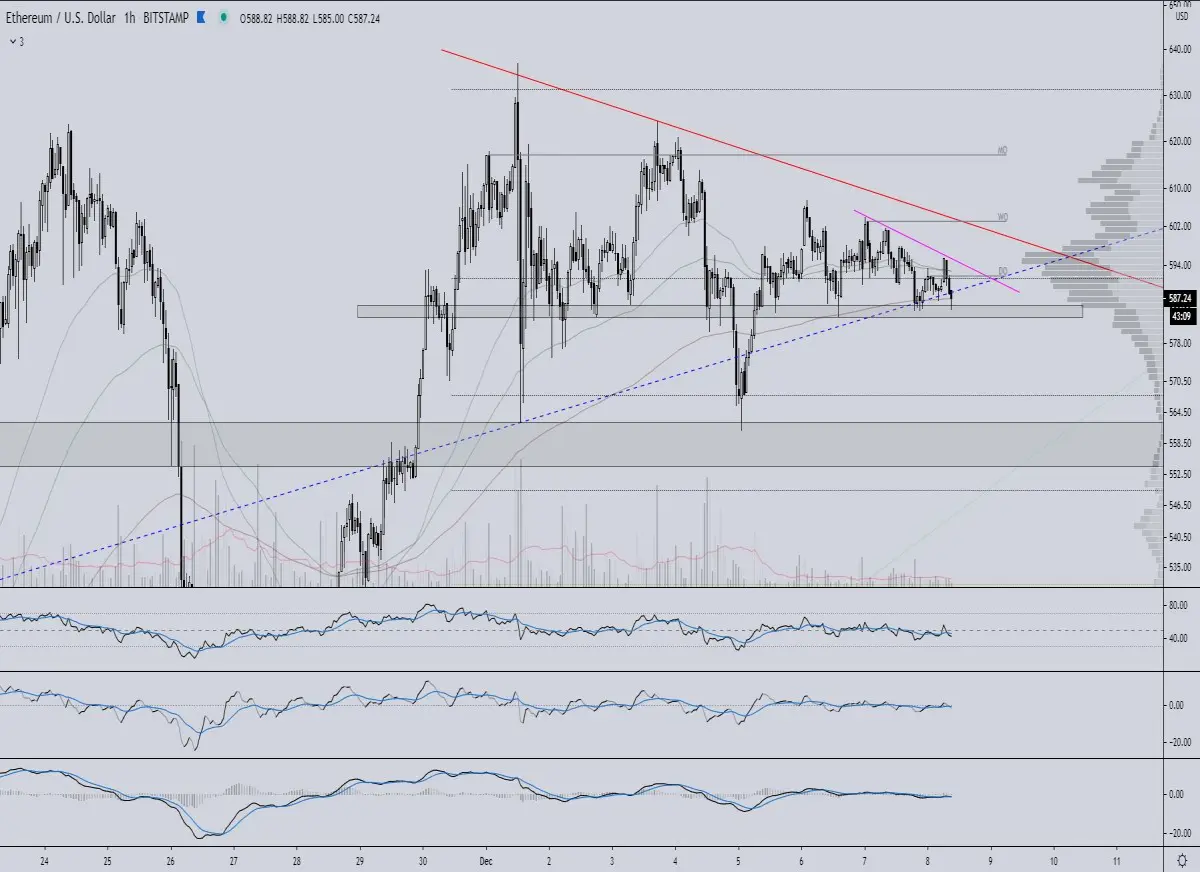
Conclusion:
For the next couple of days I expect a retrace from ETH to at least 530 dollar with a good chance that the 500 dollar round will also be visited. And as long as we can keep that level, I am still bullish on ETH in the long run.
➡️ Join our free crypto Discord server and come talk about crypto charts






