
Yesterday Ethereum broke the ATH by about $50 but failed to close above the old ATH. The price is still nicely inside the parabolic trend line between the old old ATH ($1427) and major resistance at $1238. But we can also observe a bearish divergence, will this come into play or will the price take no notice and continue rising. We are going to analyze it today on various timeframes.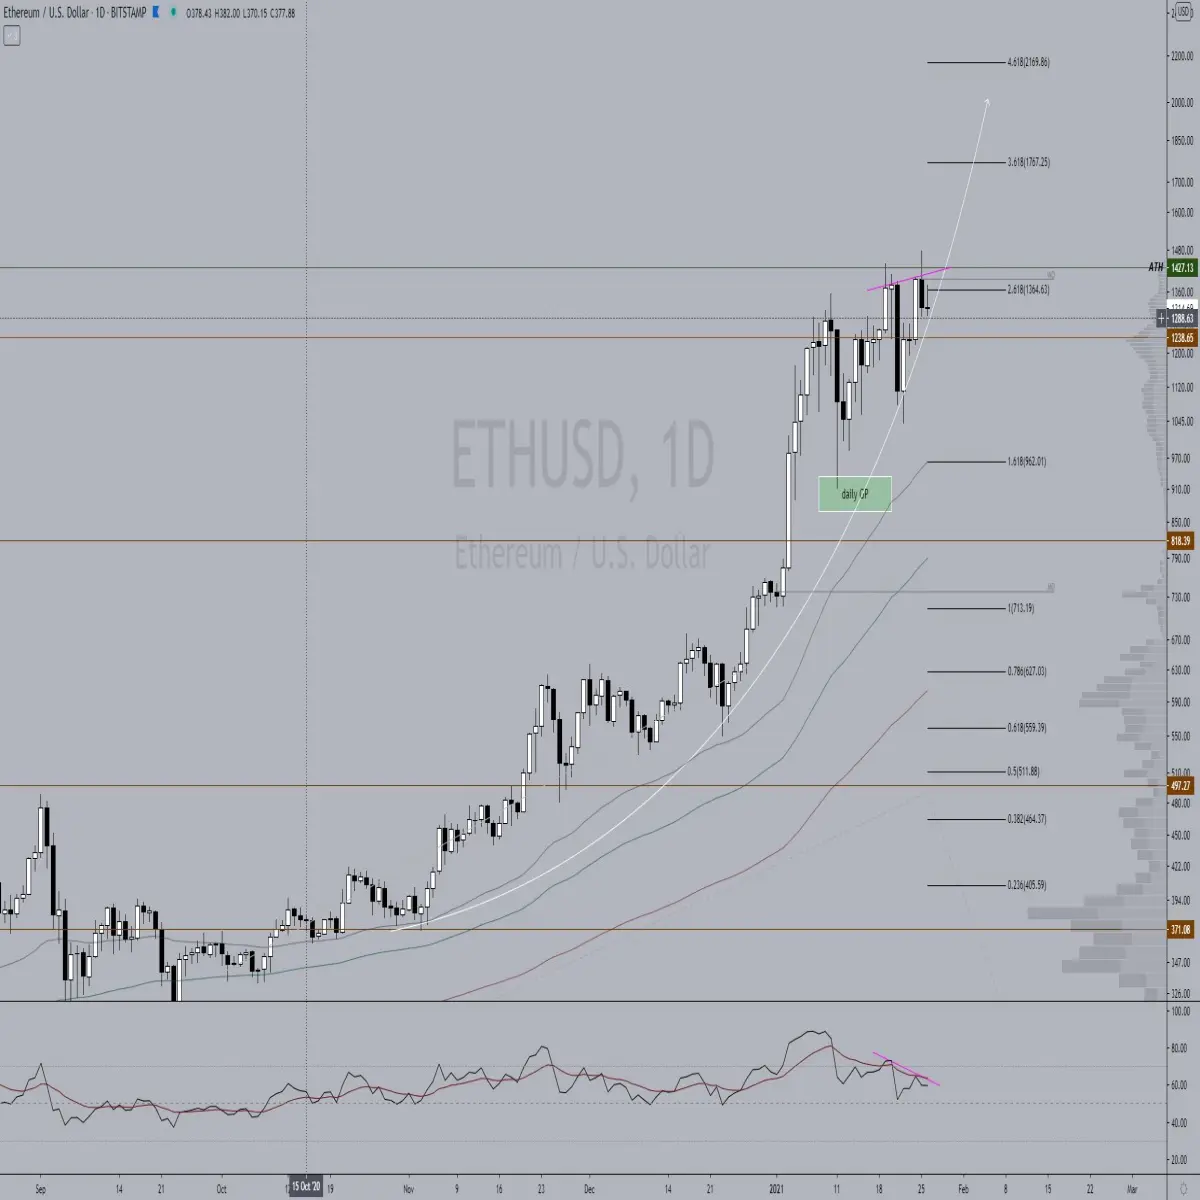
The rising wedge that we discussed in the previous analysis was played and caused a drop of plus minus 20%. After that, a top was created equal to the previous top. A higher low could be set at this time but that will have to be seen today.
The ESMAs are bullish but moving sideways. No reason to worry as of yet. We see that the rsi is also staying nicely above 50 and is even beginning to bend slightly upward again, while the ema is bending downward. If the rsi can break through the resistance of the ema it will be gusntig for a further rise. 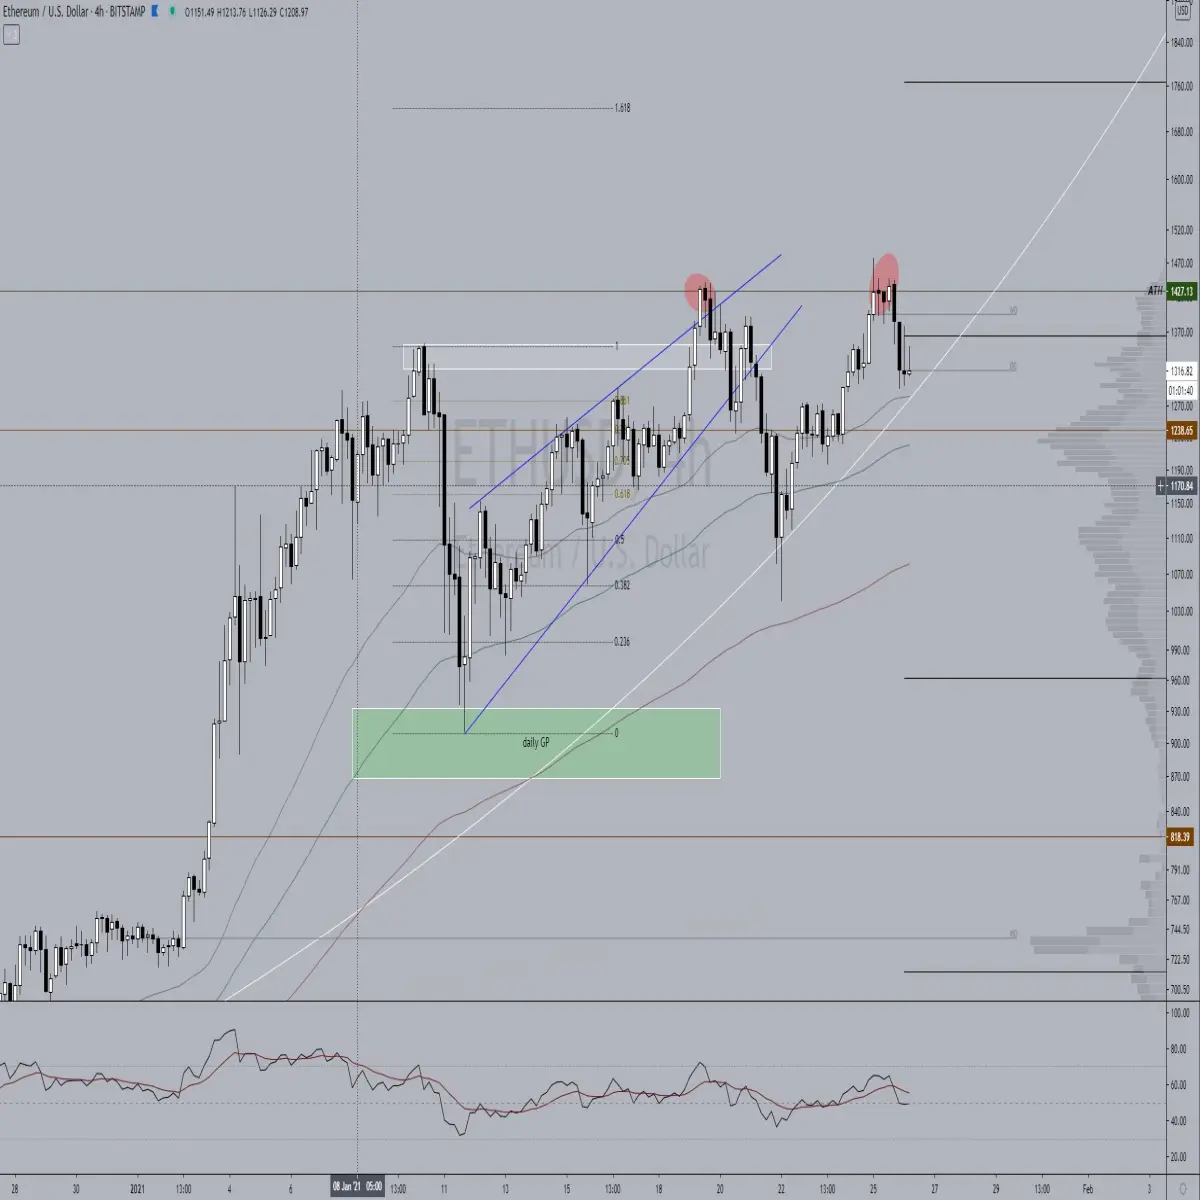
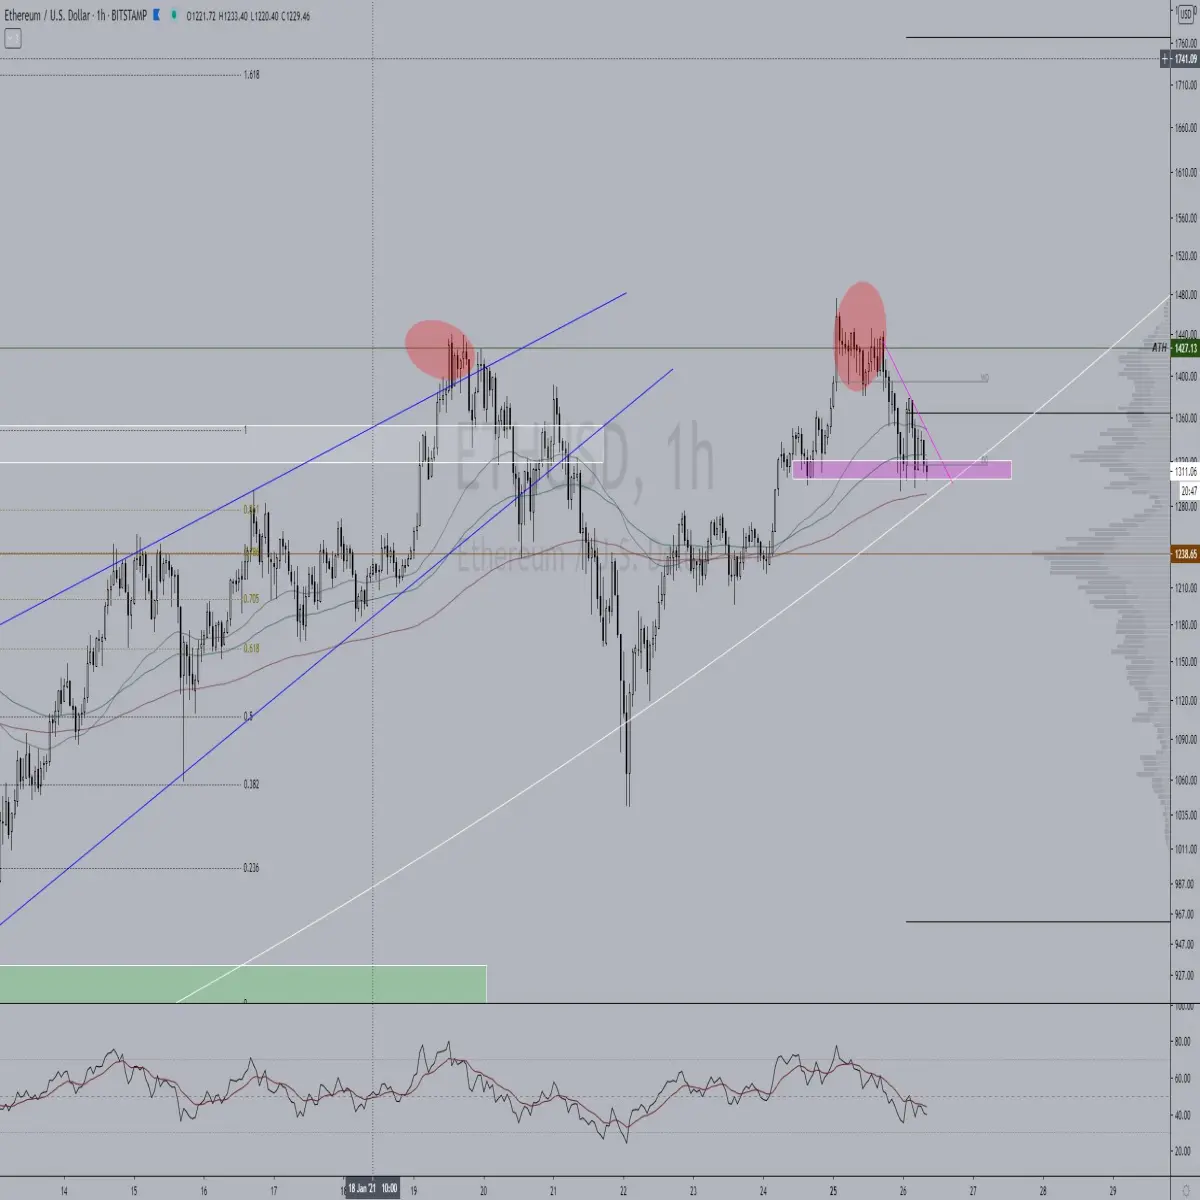
Here we see downward compression developing with the price currently receiving support from the demand zone (purple) and the ema200. The ema55 and 100 are currently providing resistance but are still in bullish positions.
The rsi is up against considerable resistance from the 50 line and the ema. We do see a higher low on the rsi which could be a 1st signal for a trend reversal.
Conclusion:
If we lose the demand zone on the lower timeframe then the last bit of hope lies around the parabolic trend line which has confluence with the ema200. If no support is found there then a decline to the major support at $1238 is very likely. Below that we can look at the $1050 - $1100 level. Resistance still lies at the 1427 which must first be flipped on the HTF to look further up.






