Ethereum continues its way to the next resistance zone at $818. Currently trading ETH between the Fibonacci level -0.236 and -0.382. We are still seeing the indicators in favor of the bulls and on the macd the bullish momentum is starting to increase. Furthermore, I see little new information on the weekly chart.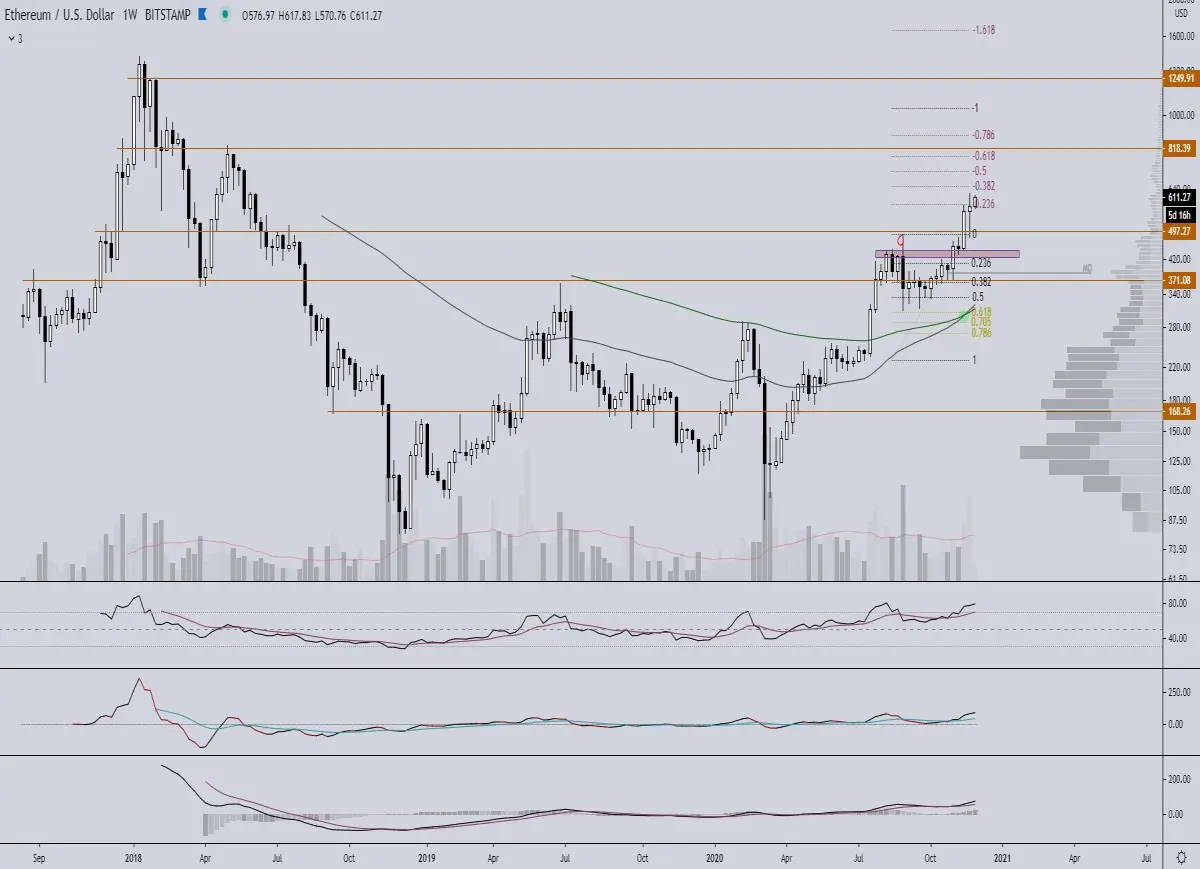
On the daily we already see more info. There has been a golden pocket retrace of the last inpulse wave. This was also a retest of the earlier high we circled in red. What also stands out is that there might be a bear divergence. This is not yet confirmed on this timeframe. We will therefore look at a number of lower timeframes to see if it forms or plays there as well.
The ema's are favorable for the bulls and the macd has had a bounce from the signal line and the bullish momentum is increasing again. On the rsi and lbr we see the possible forming bear divergence and also a rejection of the 70 line for the rsi.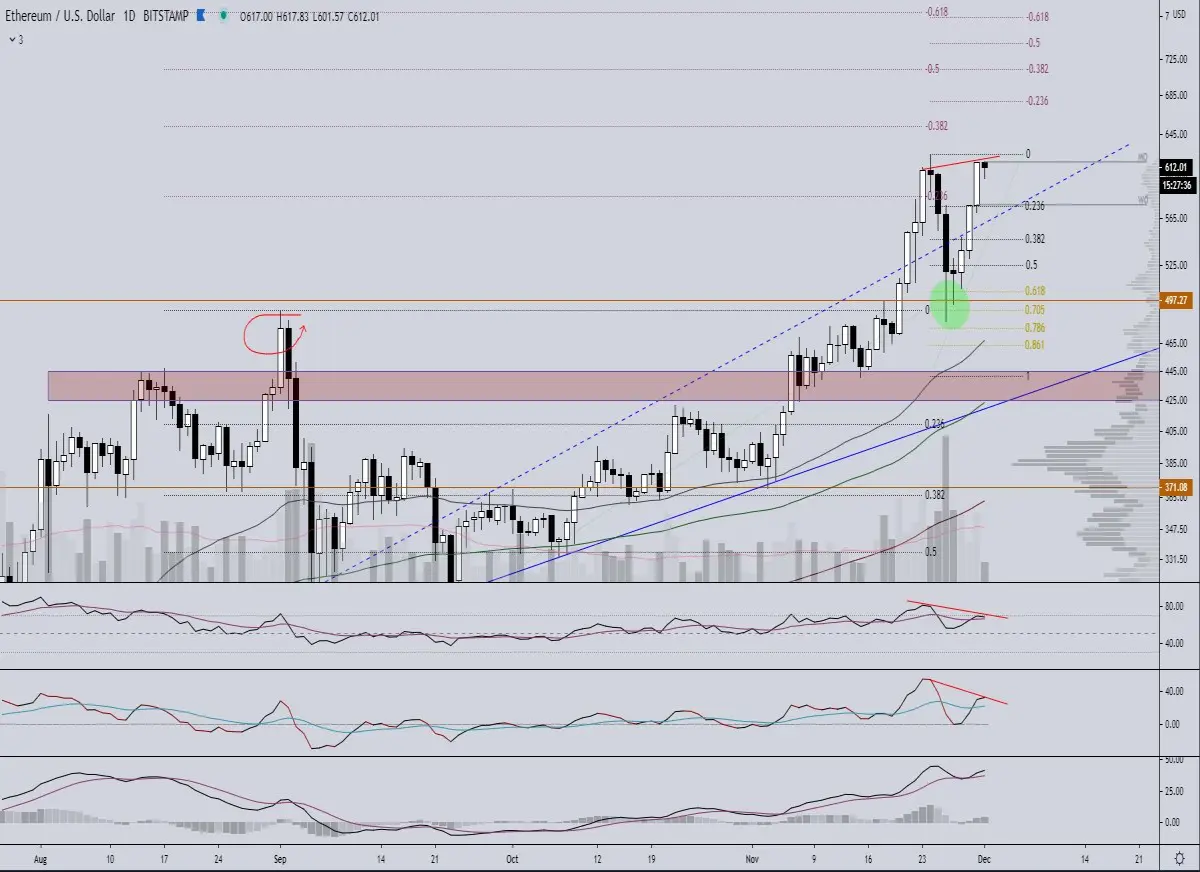
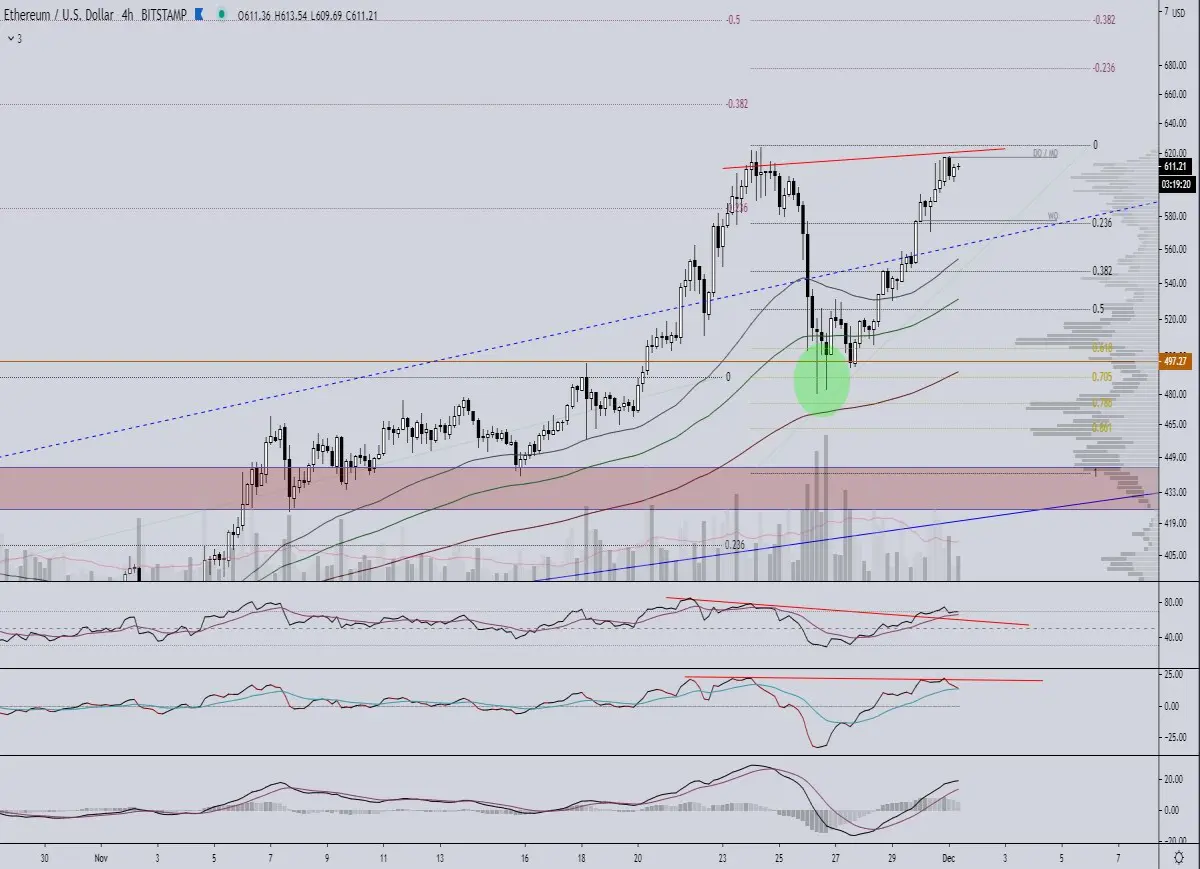
Also here we see the divergence and what is striking is that the rsi has already broken the trend line of the divergence. We also see this on the 6h and 8h graph. In most cases this is an indication that the price is going to make that move as well. And given the rsi that is above the ema and at the 70 line I think the price will follow plausible. The lbr hasn't crossed the trend line yet and is falling at the moment even testing the signal line.
➡️ Join our free crypto Discord server and come talk about crypto charts
On the 1h graph a new / different divergence is formed which can cause a slight decrease. We see on the rsi and lbr that at both two divergences are formed one after the other. And the proverb 3x is true here. Be careful when the rsi, lbr and candles hit the trend lines again. 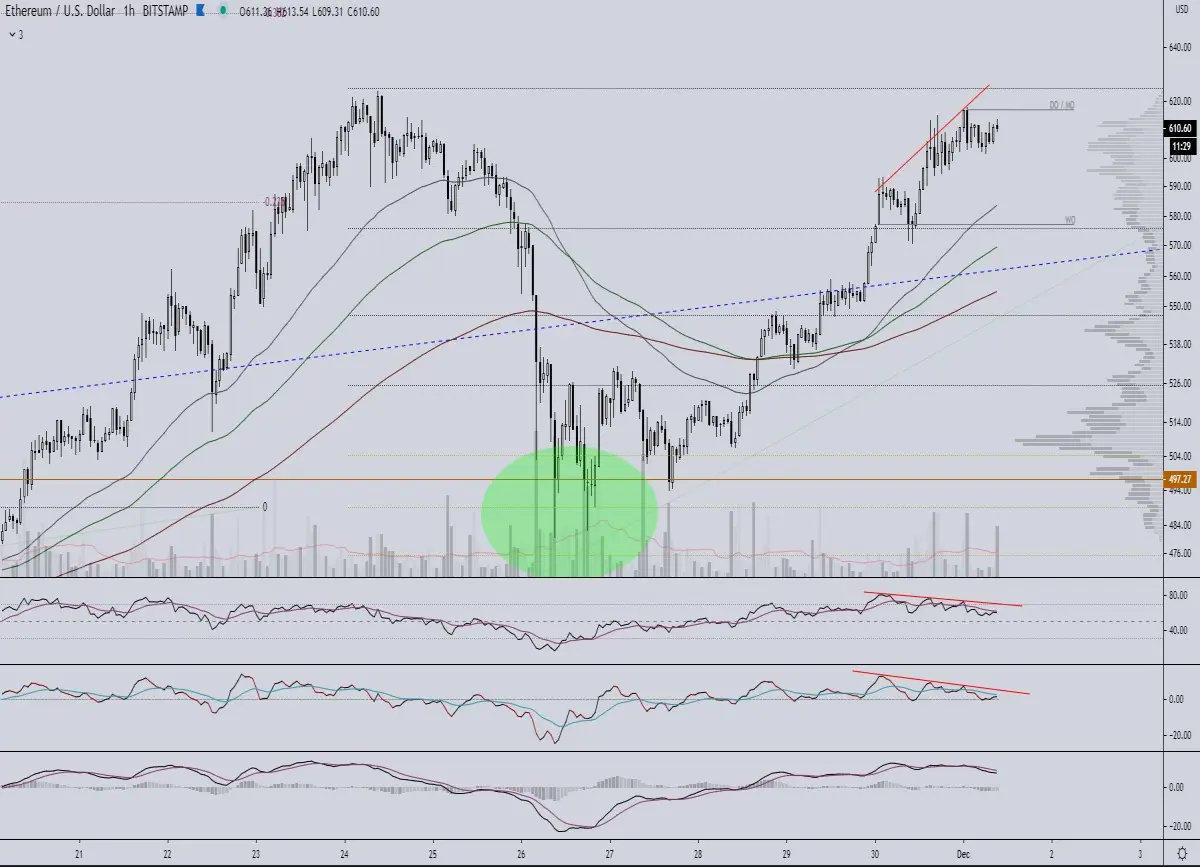
Conclusion:
Overall I am bullish on ETH and expect a test on the HTF at the $818 resistance level. Shortterm maybe an increase towards $625 after which the divergence on the 1h can play out. A logical support level would be $575 - $590. Major support on the HTF is still around $500 - $530.






