
The closing of the week last night was the highest ever for Bitcoin. Are we going to continue rising in the last month of 2020 or are we going to see a retrace / consolidation? We'll take you through the different timeframes again this week.
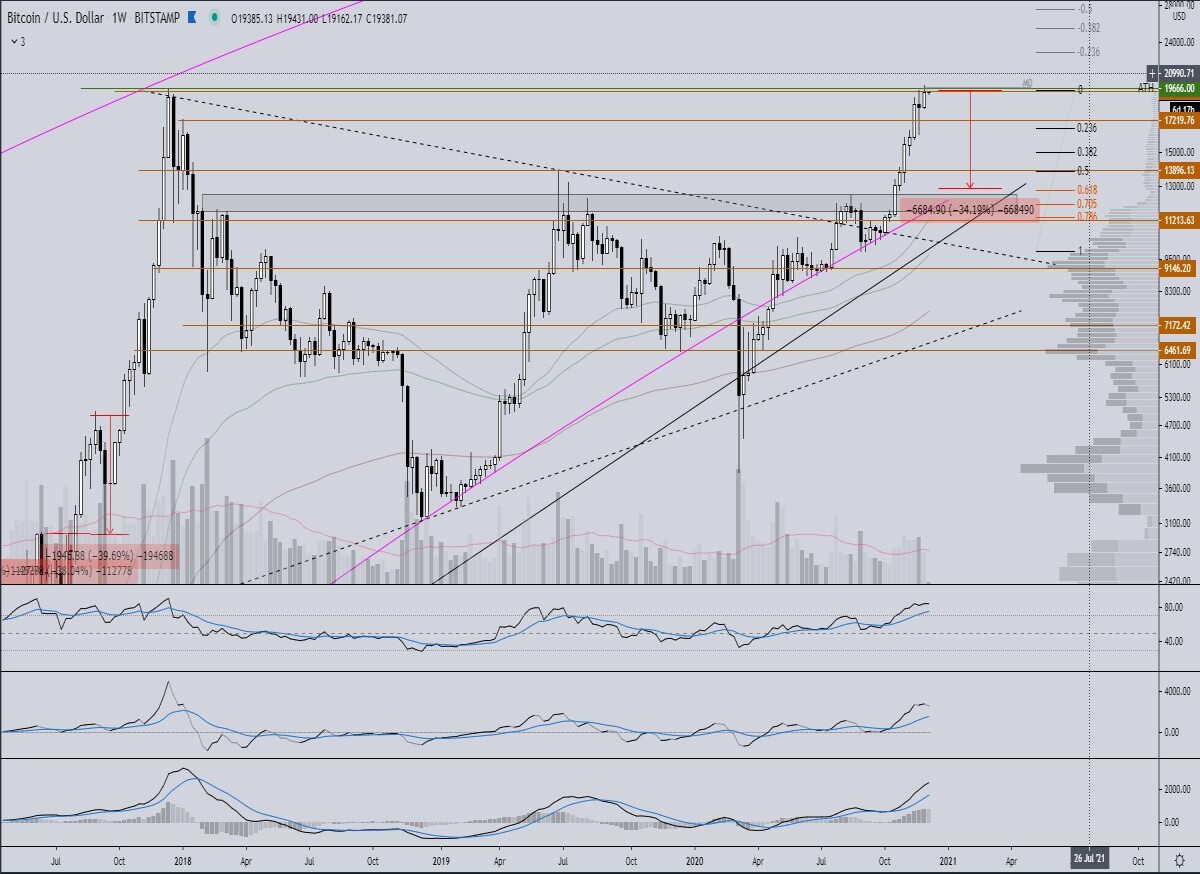
The weekly timeframe looks pretty bullish. Ema's are rising in one line. The rsi is in the bullish area or as I often call it the bullring. The rsi is flattening a bit and moves sideways with a rising ema. When these two bearish crosses there will probably be a small retrace. The lbr shows pretty much the same as the rsi only the lbr is slightly descending. The macd is still up full throttle but the bullish momentum flattens a bit.
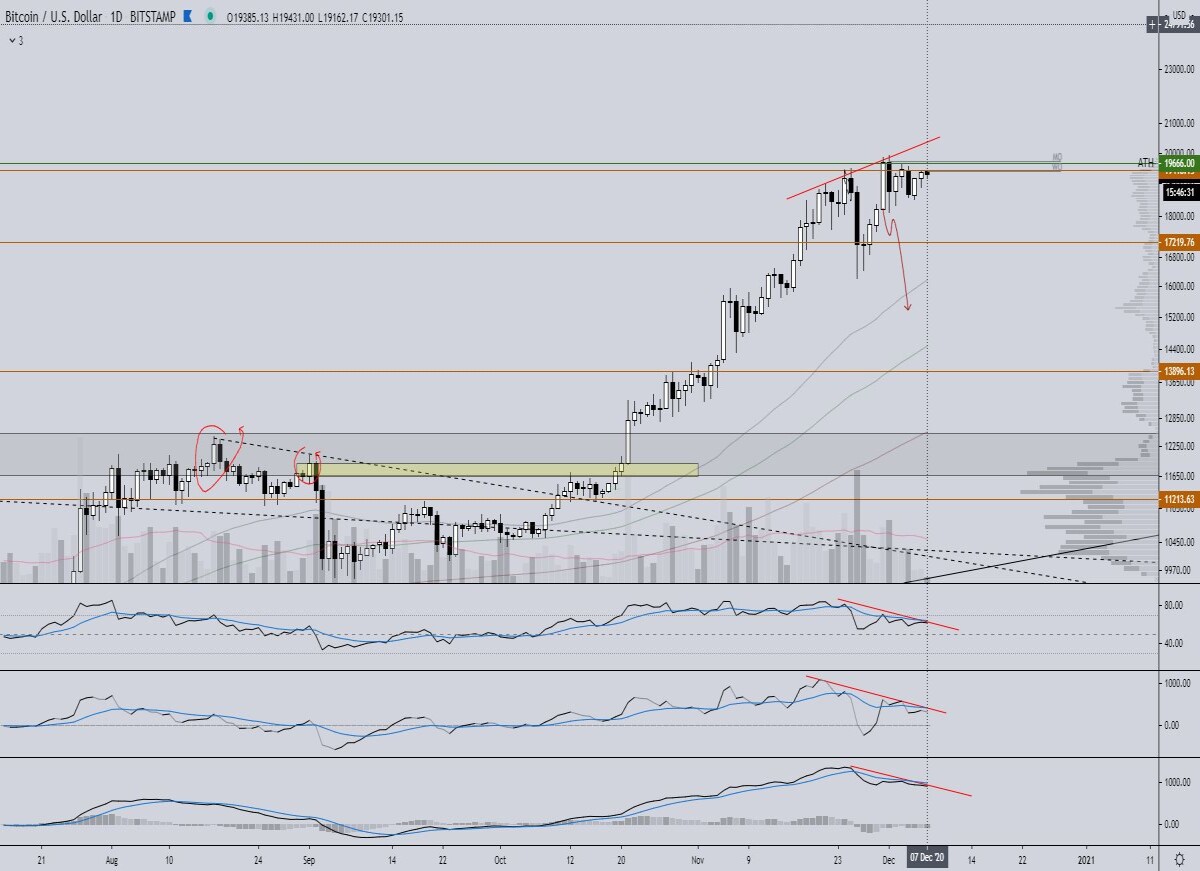
Daily we see a bear divergence on the rsi, lbr and on the macd. This is often an indication that it is a strong divergence if it occurs on all three indicators and also on a high timeframe. What you should keep in mind, however, is that BTC is now trading against ATH and the three indicators are standing against the resistance line which indicates the divergence. When the ones at the top are being broken through, there is a big chance that the price is going to go after them.
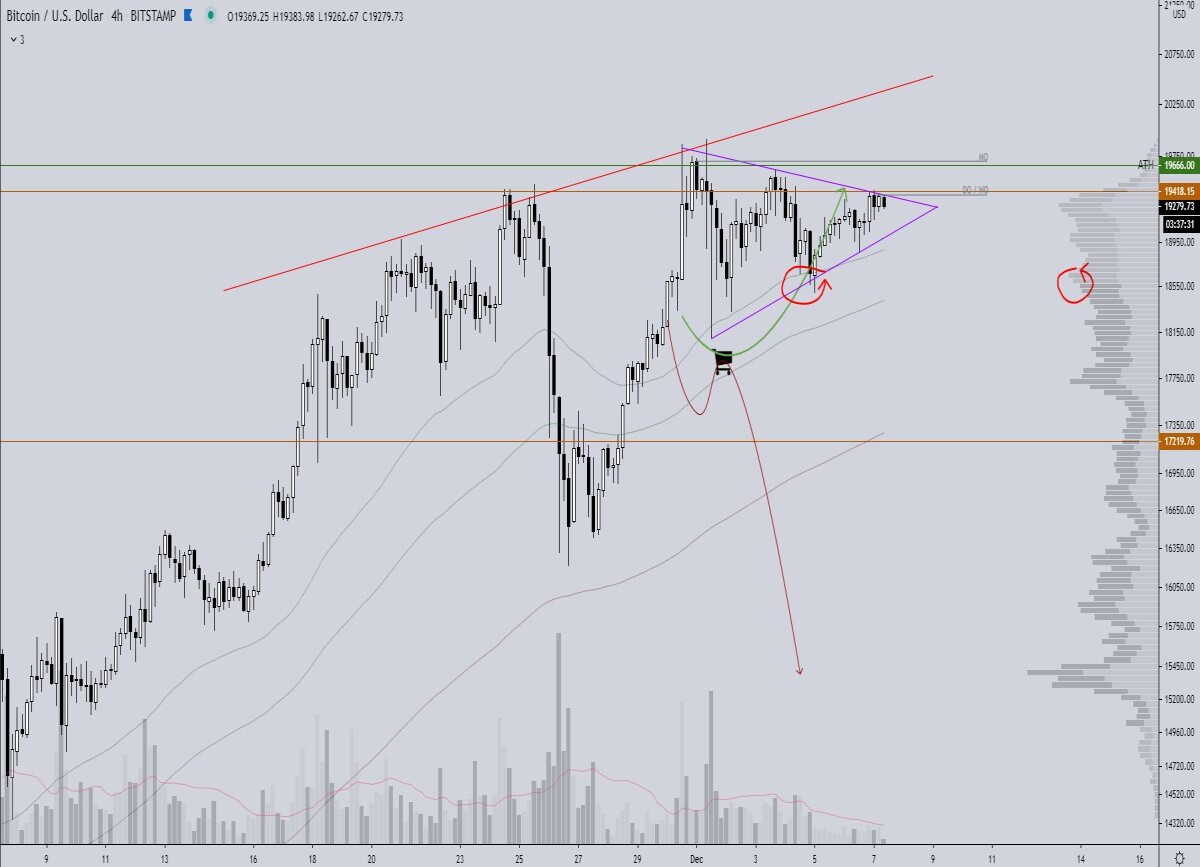
On the 4h is a nice bullish triangle formed as from the booklet. The wave pattern in the triangle is perfect and the volume is decreasing as the pattern is formed. I left the red trend line that indicates the bear div on the daily. If the triangle breaks out at the top, BTC might encounter resistance and form a bigger div on the daily.
Conclusion:
On the 4h it seems quite bullish. In case of an outbreak at the top of the triangle, the eATH would be tested on 19918 and might be broken. I expect resistance of the red line around 20.4K. In case it breaks through bullish as well, there is plenty of room for it.
If the triangle breaks at the bottom, there will be a lot of support on the 18.5 - 18.7K. On the chart I have marked this with the red circles. When this happens there could be consolidation (sideways movement). If BTC loses that level then e rop is 17.7K support and below that at 16.4K.
➡️ Join our free crypto Discord server and come talk about crypto charts


