
And again there has been a wonderful week for BTC where the Fibonacci 1,618 has been reached. Is it time to catch your breath now or will BTC continue to rise towards the pink trend line or higher. We are going to take you through the charts of Bitcoin.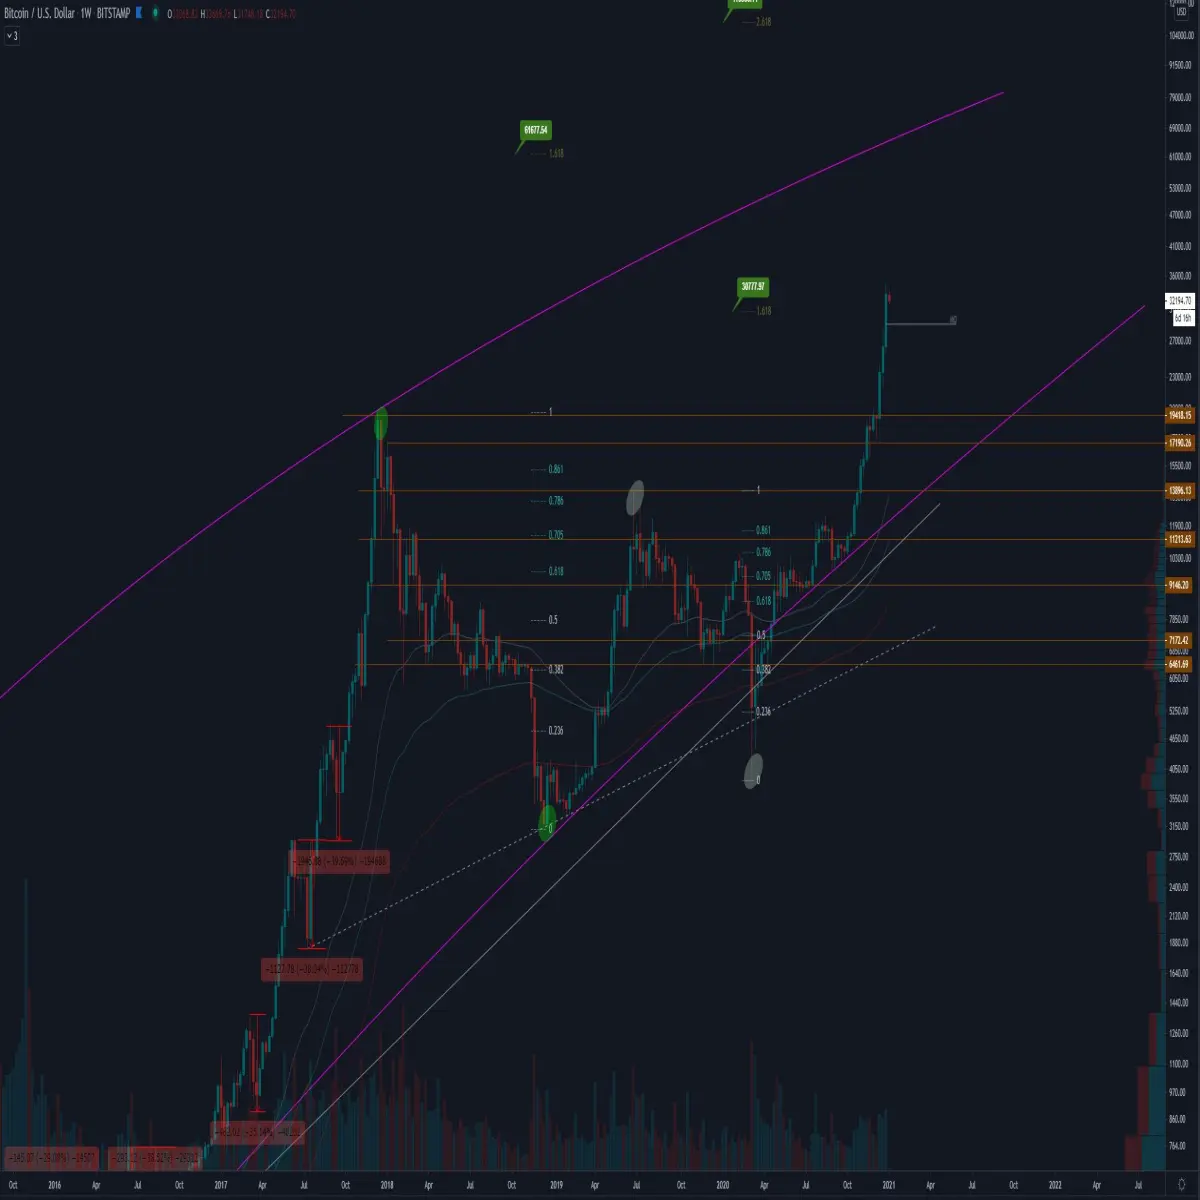
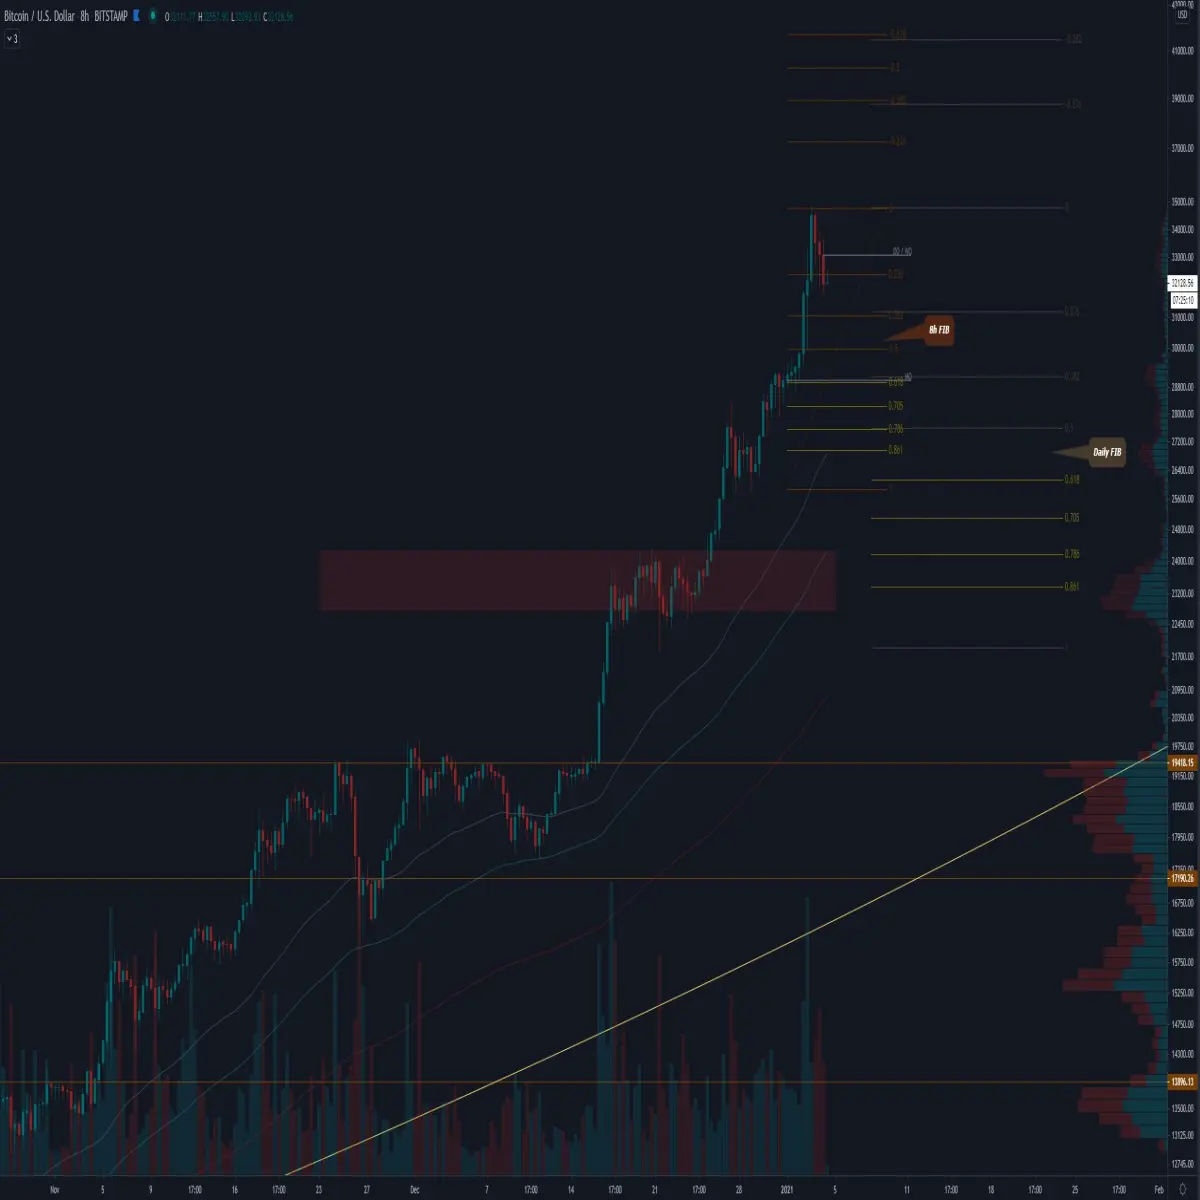
On the 8 hour graph we can already see the first signals of a retrace. Now we see a 3 black soldier candle pattern. With this local top confirmation we can pull a Fibonacci and then we see the golden pocket lying at the level of the order block. But when you look at the daily Fibonacci you will see that there the golden pocket has confluence with the underlying orderblock marked in red.
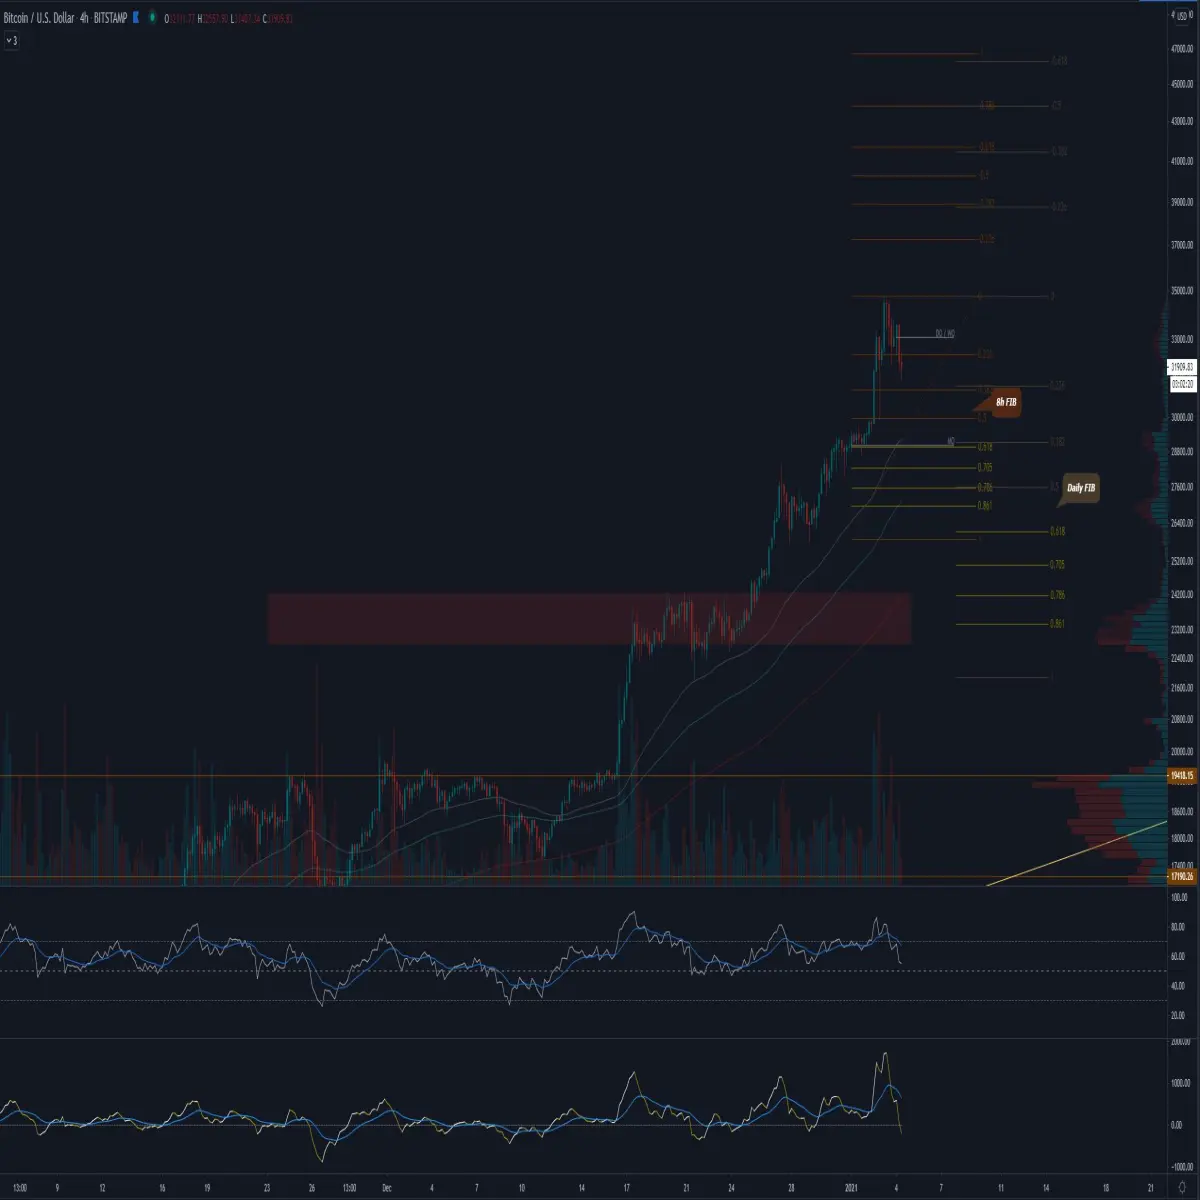
The 4 hour chart clearly confirms the retrace for me. Around the monthly open there is a nice local orderblock to see and the Fibonacci 0.618 is also on it. Many points that coincide confirm a powerful signal, no guarantee! And if we look at the ema's 55 and 100 they also have confluence with the golden pocket, which makes it even more powerful.
Conclusion:
Bitcoin is mega bullish in my opinion and now seems to be making a retrace. The levels I'm looking at are for support the first opportunity around 27.7 - 29K and below that a bit lower around 23.5K. If this can't keep it up we need to look at the 19K.
The resistance in the short term we can look at are the Fibonacci levels 0.382 and the 0.618 of the 8h with a price of 38.6K and 41.4K.
Also, If you are interested in trading, I would suggest you try out Coingrats free Discord server where we discuss the market and share interesting content. We have also have a free premium section where we share trading signals for Bybit. More info in our Discord server






