Last week an indecision candle was placed on the chart and was closed under ATH. There is no clear top on the weekly chart yet but if you would look at it as a preliminary top then a golden pocket retrace coincides beautifully with the flipping of the major R/S zone (grey bar) and is also a drop of around 30%. Drops of around 30% are more common in a bull market and is just a healthy drop when the price is quite bullish. I have marked the drops for you from the previous bull run.
You can also see that when you measure the whole bull run with the Fibonacci the pullback has dropped to 38.2%. In principle you can say that on the (whole) long term investment BTC has never been bearish. 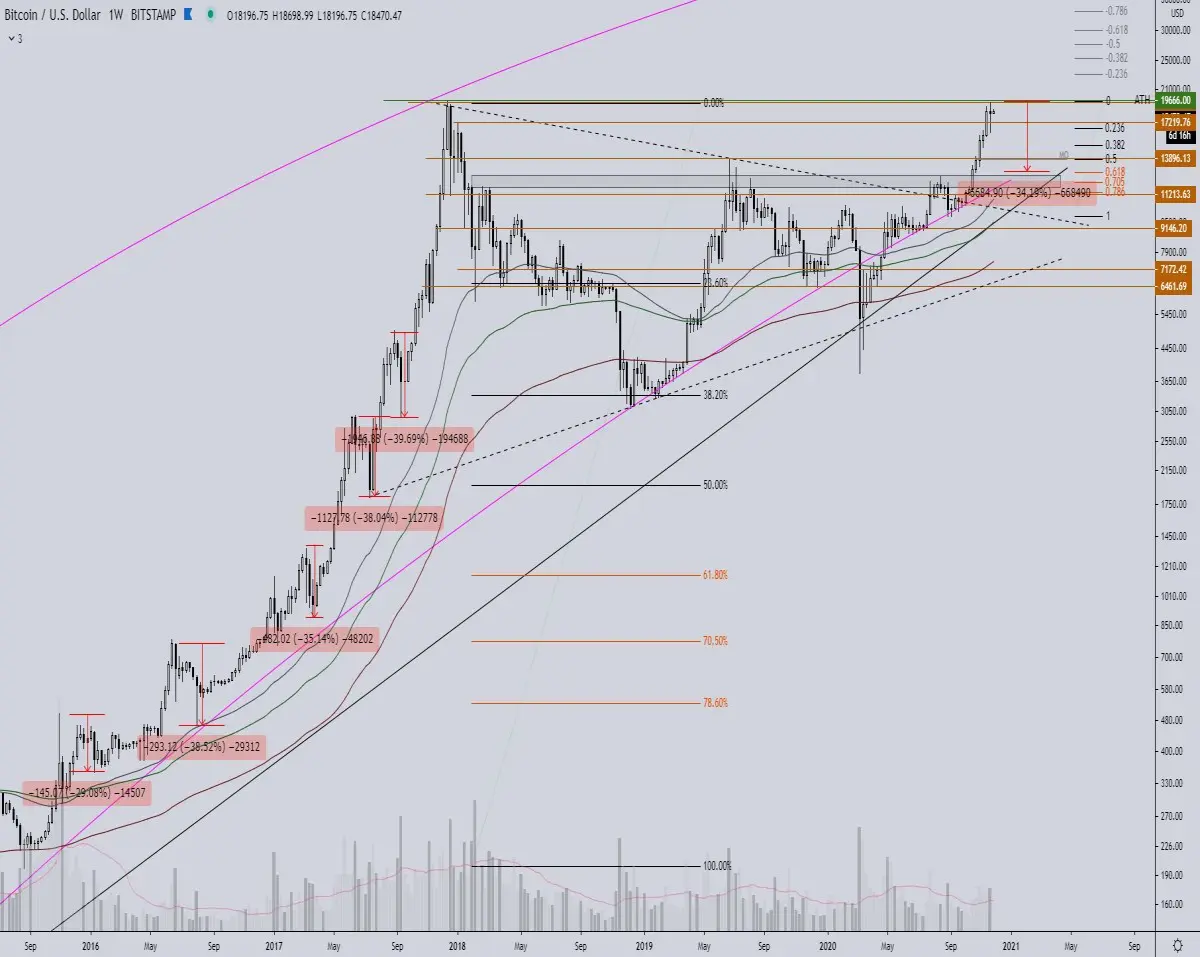
➡️ Join our free crypto Discord server and come talk about crypto charts
A clear rejection around the ATH. Immediately on the 4h graph you can see that the divergence we discussed last week is over. As a result, the course to the next support has dropped around 17.2K and has been well absorbed. We can say that a higher low will be set, but for this the daily still has to close.
The rsi is under the ema and just below the 70 level. We also want a bounce from the center line. On the lbr and macd we see the bearish momentum of the drop decrease, BTC wants to put a new ATH then there should be a bullish crossover on the lbr and rsi and no hard rejection.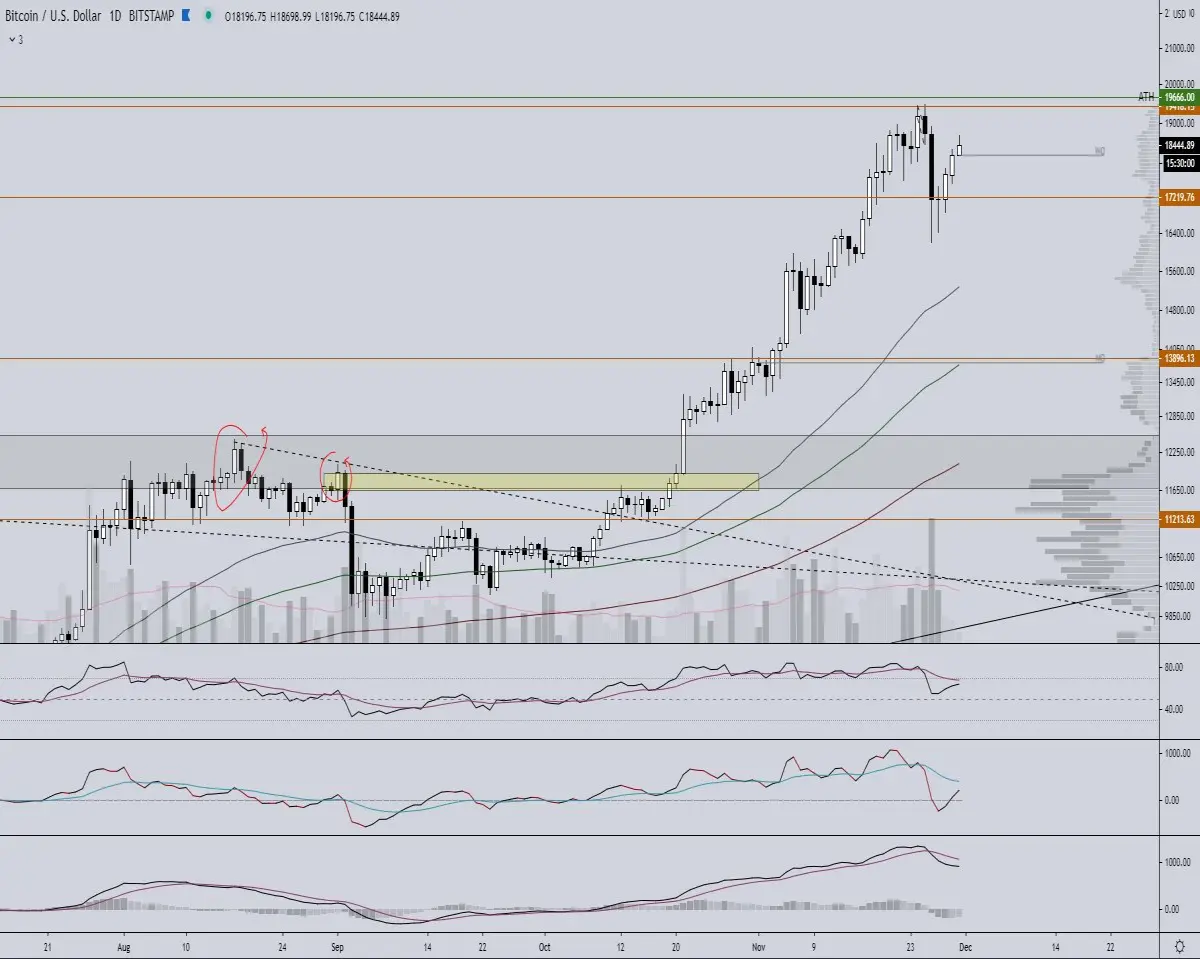
First of all, you can see the previously mentioned bear divergence that was played with a drop of no less than 16%. Beautifully captured and then further increased. However, it can now go two ways in my opinion and as you can see I have drawn them in and put the cart ready.
When you measure the drop with the Fibonacci tool, Bitcoin is currently on the golden pocket retrace for a move down. However, the price is still above a local oderblock which can also serve as support.
The ema's have fallen slightly and are currently rising again which is a good sign for the bulls. The rsi and lbr are still moving up smooth with a retrace to the ema here and there as is the case now. As long as they don't show any bearish crossover there is no reason to panic. The macd rises quite bullish and has managed to cross the middle line without any problems. The bullish momentum is constant.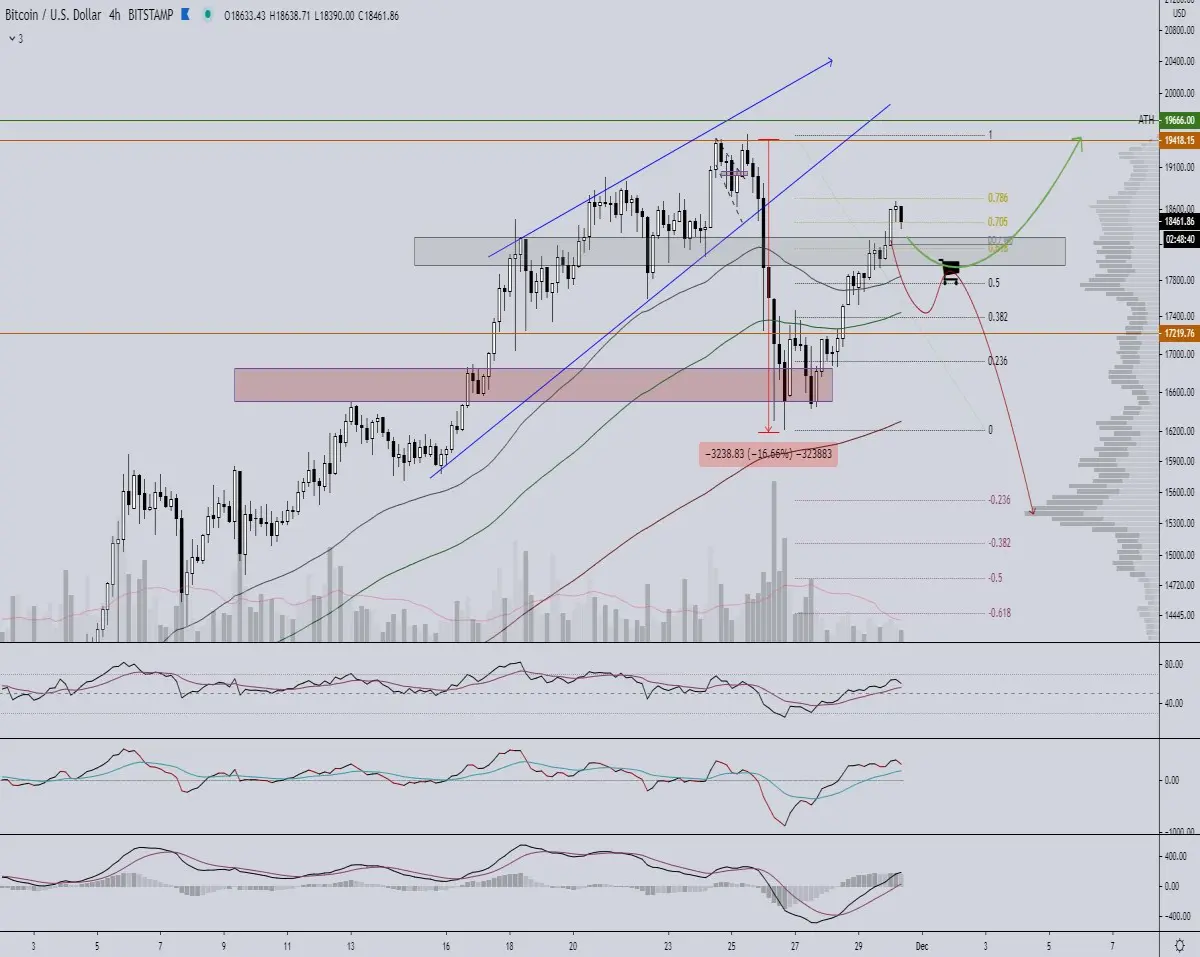
Conclusion:
I keep the 4h chart myself as confirmation and see what the price in the grey block will do. Ear both sides there is a golden pocket retrace (4h down and 1h up). Shortterm support we see on 18 - 18.2K and on the longterm 16K and then around 15.4K. Coming under that will mean that we can go a lot lower.
Major resistance is of course the ATH and when we see a bounce on the gray block on the 4h and also on the daily, I expect that the attack on a new ATH can't last very long anymore.






