
$ETH continues to watch very close to red bottoms. The rise that came yesterday has again sold out from the very horizon of the blue zone.
Honestly, among the strong probabilities that today will be a little close to horizontal, I still think that more red bottoms and lower visits will take place.
If the first level to watch today is the red horizon around USD 1788, if there is a rejection, this may be a sign for the red bottoms, namely the USD 1700 level. If 1788 does not refuse, max. Up to 1844, there may be a rise and then a downward wave.
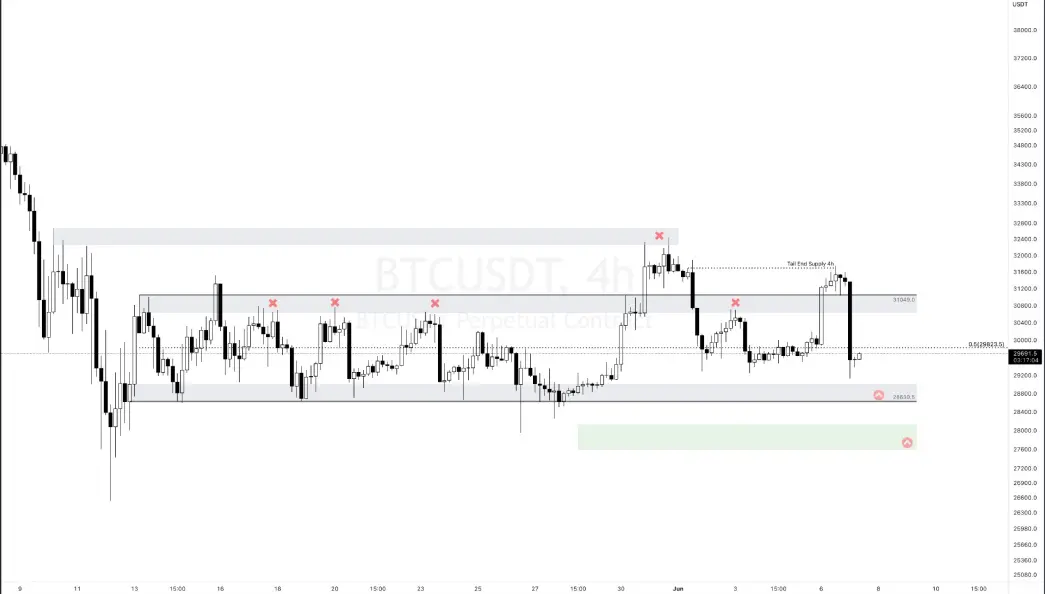
From the analysis that passed $BTC, we saw 29675 - 29429 🎯. We could not reach the target located around 28.7. This place remains on my radar. In addition, I positioned the green box in the 28/27.5 range, and I will keep it on my watch list as a target.
Today it can pass horizontally and with some reaction, the first rejection point is around 29.8, if there is no rejection from here then I expect a rise up to 30.6 and 31 and a rejection from here.
After the strong declines, as soon as the short is opened, it is expected to go horizontal and create a range. In general, the upper limits of the range are determined with the first relatively strong reaction after the fall. If there is an exit from this range or a visit to the upper range area afterward, it would be reasonable to enter a short here.
Good luck with,
It is not investment advice.
Graph Source: Tradingview






