![XBT / USD technical analysis [BITMEX]](https://www.publish0x.com/img/20077.png?action=resize&ar=1&inv=0&ori=1&st=1&up=1&w=1140&signature=85d9c9853b08d6e7b4b25f8ea59f3981d4dc21450e0a6930ced4c32ebc528fc9)
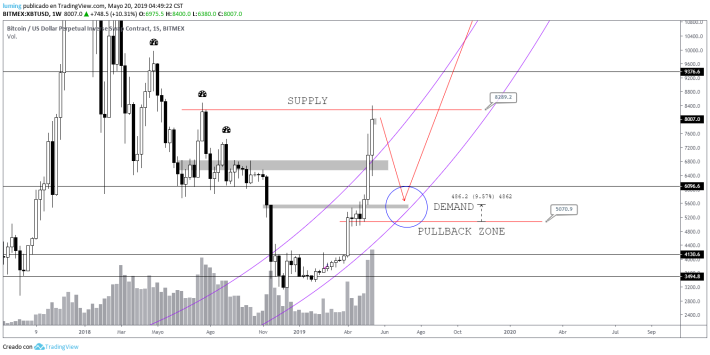
BTC seen from the temporality of 1W we can see how the current candle has reached an important point of supply for bulls in the resistance located at 8289, when reaching that point the price has begun the process of decline, within the chart above I have also indicated the area of demand where the price should get support to continue with a new bullish movement to reach 11,500.
If the price falls below the support at 6096, we could see the price fall into the price range of 5500 - 5070, thus coinciding with the support of the parabola, at that point we should see a pullback that resumes the support of 6096 to continue the upward movement.
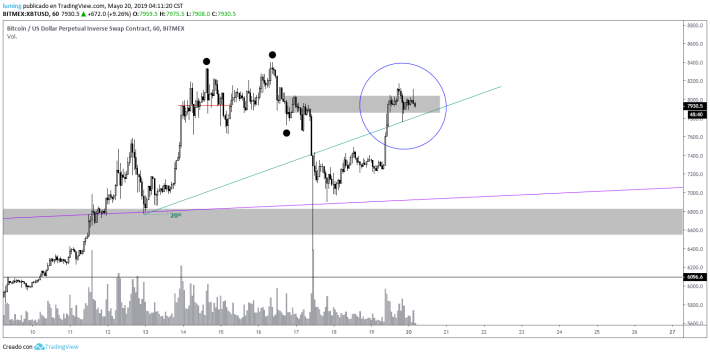
BTC seen from the temporality of 1H we can see how the price action shows a bearish structure, after BTC drew us an LH in the 6385 we saw a strong increase in the price, thus returning to the 8.180. Currently the price is consolidating in an important area of supply after the pullback, the bulls at this time will be thinking about leaving their positions in long. In the chart above I have marked the angle closest to the price action where the price found support correctly, however the volume has been falling, the movement has lost strength, it will be a matter of time before a strong bearish movement occurs.
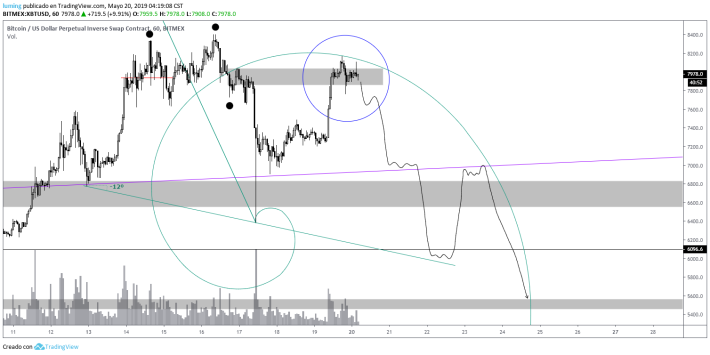
Using the fibonacci spiral tool we can observe how the candles have reached the wall of the spiral thus coinciding with the point ITZ of H1 marked on the chart with a gray rectangle, I have drawn the possible trajectory of the price, once it falls from the support of 20°.
In conclusion, as I mentioned earlier, BTC having already marked an LH at 6385, we can predict a new LH that follows the same angle of fall of 12°, although this is very likely to happen and what we are seeing in the daily candle is only a trap for bulls, we must still be attentive to the price movement and ensure with the next daily candle, the price must not close above the resistance of 6289 for the downward movement to occur.
As I always say, you have to be aware of the movement, invalidations can occur, there is no 100% reliable analysis, take your own precautions when trading.


