![GNT / BTC technical analysis [BINANCE]](https://www.publish0x.com/img/17581.png?action=resize&ar=1&inv=0&ori=1&st=1&up=1&w=1140&signature=2d67475d46e0ee8525d2f779e7d7fa018d4936e842dc2ea3f6f698e118d391ce)
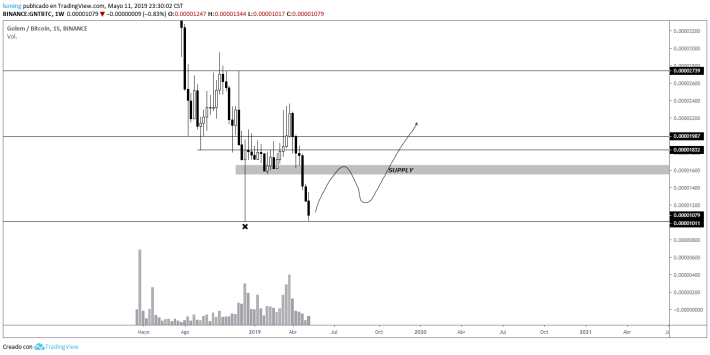
GNT seen from the temporality of 1W we can see how the current candle is finding offer shortly before reaching the support located at 1011, we should expect more input volume in the coming days that will raise the price even more, in the chart above I have pointed within a gray rectangle the nearest bid area where the price should arrive very soon, This point is located within the price range of 1580 - 1610, it is very possible that we will see the price reach the supply zone and then have a brief retreat to return to pick up bullish momentum that manages to break the resistance located in the 1832.
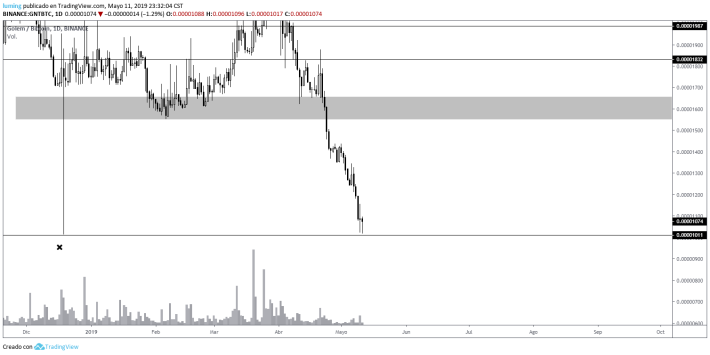
GNT seen from the temporality of 1D we can see how the previous candle has shown a momentum change in the tedency, which is being confirmed so far with the current candle that we are forming a hammer candle, as is known, this type of candle at the end of a bearish trend is a sign of a reversal of trend, we would only confirm with the closing of the next candle.
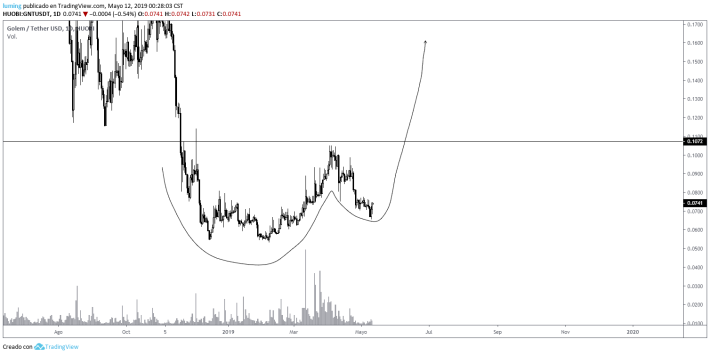
GNT in pair with USDT we can observe how is beginning to gain momentum the current movement after a correction produced after the formation of wave number one that was rejected just before reaching the resistance at 1072, this resistance has not been tested yet, so we should expect that wave number three of the current bullish movement reaches that point and test it.
I also pointed out in the chart above the formation of the setup Cup and hadle, a bullish setup well known to all traders, I have drawn the path that the price should follow in the next few days, it should reach without problems the area of supply located within the price range of 1627 - 1671.
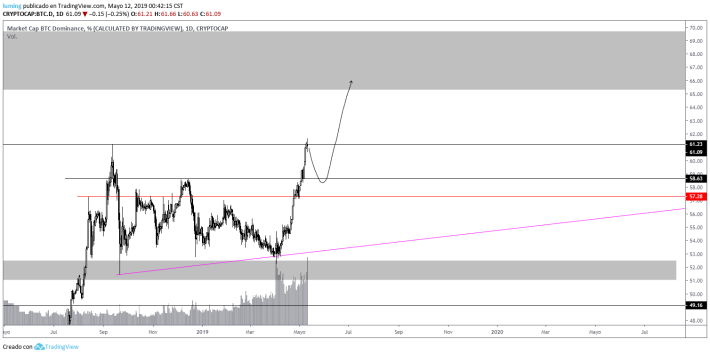
Something very important to take into account in our analysis of altcoins is the movement of the dominance of the BTC, as what happens here greatly affects the general movement of the altcoins market, in the chart above we see how the current movement is finding resistance at 61.23, after the break of the resistance of the upward triangle, the price seems to show signs of a possible throwback (possible trajectory drawn on the chart), if so, this would be beneficial for the above mentioned with GNT.
In conclusion GNT seems to be in an excellent buying moment, the daily candles are showing the first signs of a change of trend, the correction of wave number two of its pair with USDT seems to have finished and to be starting wave number three, to this we add that the dominance of BTC could have a temporary descending before continuing rising, we have enough indicators that next week will be an excellent week for GNT.
As I always say, you have to be aware of the movement, invalidations can occur, there is no 100% reliable analysis, take your own precautions when trading.


