Subtitle: Do Not Trade Based on Green Candles Again. Here is How Smart Money Trades Before a Pump.
“If you’ve been in crypto for longer than one cycle, you know what I mean: you sell an asset because the market action looks ‘boring’ and it’s lateral for weeks on end, only for it to moon 40% two days later.”
Why is this happening?
Because you fell for the "Boring Zone." This is exactly where Smart Money (Institutions and Whales) do their work. They don't buy when the price is vertical; they buy when nobody else is interested anymore.
This is known as Accumulation. And the thing is, it is actually visible, unlike with traditional finance—and you can see it happening if you know where to look on-chain.
The Anatomy of 'Silent Accumulation'
Whales have a problem with Size. When whales decide to invest $5 million in ETH/SOL simultaneously on the Binance exchange, they will drive up the prices and ruin entry conditions for themselves.
Thus, what they do is what we refer to as "Iceberg Orders" or distribute purchases over a period of time. It appears as a dull movement on the price chart, but a violent story is being told on-chain.
Here are the two signals I look for in order to identify this:
1. Exchange Outflows (The Supply Shock)
When you hold your funds on an exchange, you’re normally ready to trade or sell. When you withdraw your funds off the exchange and hold them in a cold wallet, you’re intending to hold those funds.
The Signal:# The Price is stable or slightly decreasing, BUT. a massive quantity of tokens is leaving the exchanges (Exchange Net Flow is Negative).
Whales are purchasing the dip and draining liquidity. A supply shock is about to hit the market.
2. "The Wallet Shuffle" (Large Transaction Count)
Smart money is rarely alone in its moves. A common observation would be a new wallet being flooded with a tremendous amount of stablecoins (USDT, USDC), followed by a gradual trickle into a certain asset.
The Signal: An unusual increase in transactions worth >$100k+ on a token with a low social volume.
A person is preparing themselves before the news even reaches Twitter.
How to Actually See This Data?
It’s a hassle trying to follow it on block explorers such as Etherscan, but seriously, trying to follow transactions based on hashes is a nightmare. Unless you’re a bot, you will miss the big picture.
t
Traders commonly resort to visual analytics tools. Glassnode/Nansen is probably a brand you've heard of; it's the best available, but the cost of subscription is hugely expensive, with prices ranging in the order of the hundreds each month—a big barrier for retail traders.
My Current System: For those who want institutional-level data but don't want the outrageous cost, I've recently started working with a tool called Coinift.
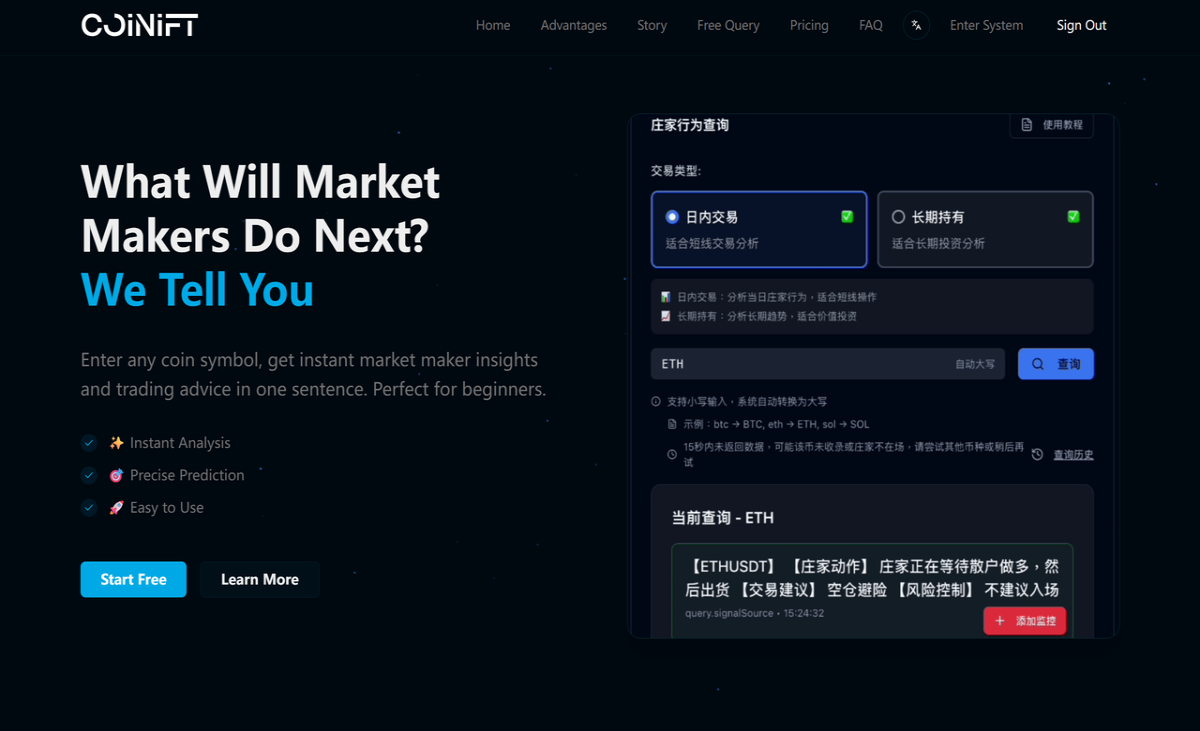
It is especially useful for one thing – “Institutional Flow Tracking”. It weeds out the smaller retail-type transactions and focuses only on the “Whale” transactions.
For instance, I use it for their "Intraday Analysis" and look for whether the fall is being accumulated by large wallets. When prices were falling, but the "Large Holder Accumulation" showed a spike in Coinift, I knew it wasn’t a crash but a bear trap.
Final Thoughts: Data Over Emotions The greatest advantage you can have in Web3 is just ignoring what you’re feeling and looking at the cold, hard facts. Retail traders buy when they feel 'Excited' (Top). Smart Money buys when retail is "Bored" (Bottom).
The next time you look at a chart doing absolutely nothing, rather than simply closing out the tab, look up the on-chain activity. The whales may be shouting at you, you simply need the right equipment and tools to listen.
(Disclaimer: This is only for educational purposes. I personally use these tools for my analysis. Always remember DYOR.)