

RekTimes Weekly Markets
18 April 2022: The cryptocurrency market has shown a growing probability of a long term break down in the price action of major assets, including that of Ethereum and Bitcoin.
While overall technological development remains impressive, weaknesses in the global economy have undoubtedly had a substantial effect on crypto retail, providing signals for long term market decline.
This article will provide analysis on the 2022 outlook for the cryptocurrency market and how the November 2021 top was a significant event.
In a rush? Here are this week's key takeaways:
- Probability of at least a temporary decline in markets soon grows
- Ronin Bridge hacked for over $600 million USD, biggest ever
- Russia looks to avoid bankruptcy and continue debt payments

Top Headlines
Wild volatility has struck the cryptocurrency market as prices have fluctuated intensely over the past several days. The long anticipated shift to Proof-of-Stake for Ethereum has once again been delayed. Originally expected in June 2022, the updated has now been pushed back to at least Q3 or later.
Outside Ethereum, Terra has continued to add other cryptocurrency assets to its UST reservers, with the majority consisting of Bitcoin purchases. The competition for stablecoin market share has continued to heat up amongst top projects. Ampleforth co-founder Evan Kuo provided this breakdown of the stablecoin debate:
Ampleforth has officially announced the coming arrival of an AMPL-backed stablecoin named SPOT.
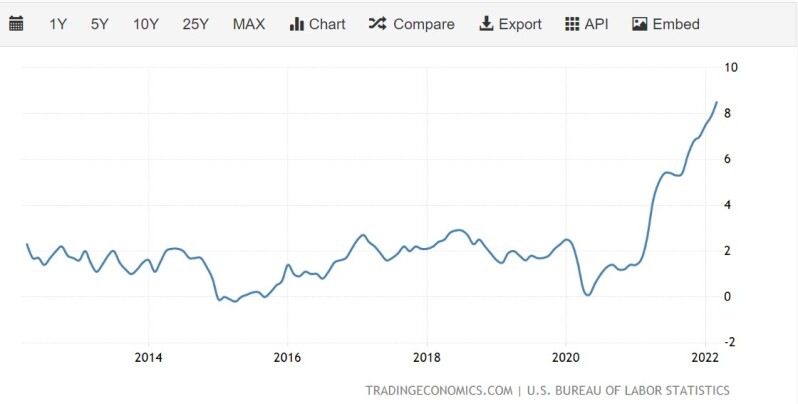
Inflation has risen to another multi-decadal high of 8.5% YoY. It is important to note that the CPI is a highly controversial figure, shifting between administrations within US politics. The raw numbers over 2021 show food prices have soared an estimated 75%, rent prices has risen upwards of 40% , and energy prices have increased 59%.
All of this tension is boiling over in both crypto and stock markets as price volatility continues to rise.
Further Reading - In the Know
- Ampleforth to release decentralized stablecoin SPOT (RekTimes)
- Introduction to NEAR Protocol article released (RekTimes)
- US Consumer Price Index updates (US BLS)
- Russia to legalize cryptocurrencies (Voi.id)

Crypto-Economy & Markets
Volatility in the cryptoeconomy has been demonstrated in the loss of capital in the Total Crypto Market Cap. High periods of volatility have plagued the market for weeks, cooling off the previous rally in March.
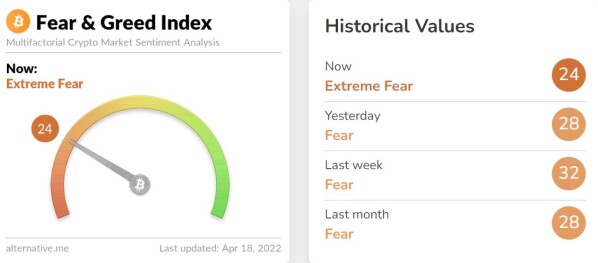
Additionally, market sentiment has declined to a status of ' Extreme Fear', down from 'Fear' at 32 points to now 24 points.
The full Fear & Greed Index chart is shown below:
Total Market
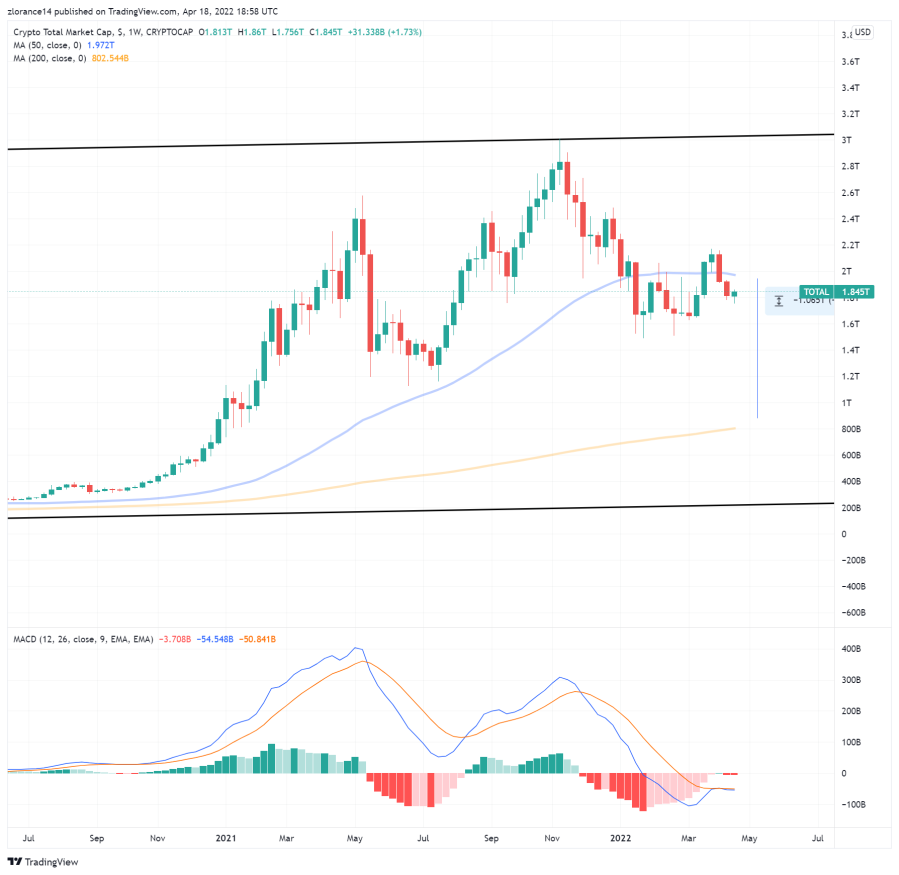
On the daily chart, the Total Crypto Market fell well below its 50 DMA and has failed to break above this level (now at ~$1.88 trillion USD). The crypto market remains nearly 13% below its 200 DMA.
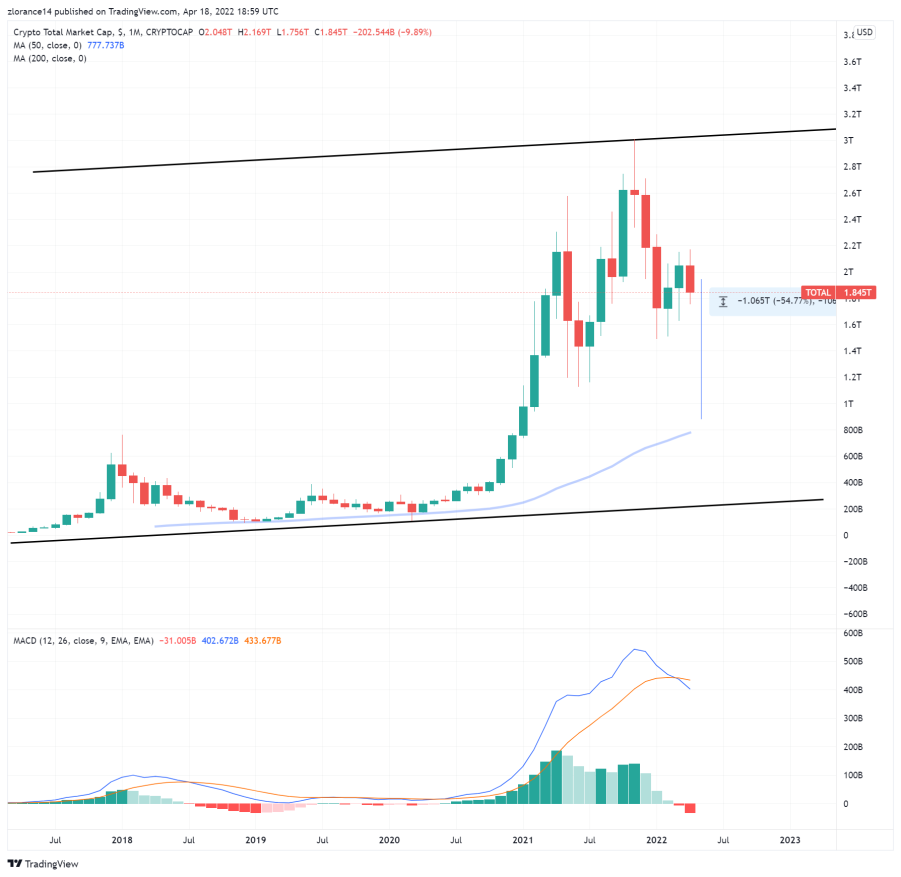
The monthly chart for the Total Crypto Market shows the real concern, clearly demonstrating the first bearish MACD crossover since the market crash in 2018.
The Crypto Total Market Cap is shown below (TOP - Weekly, BOTTOM - Monthly):
Bitcoin
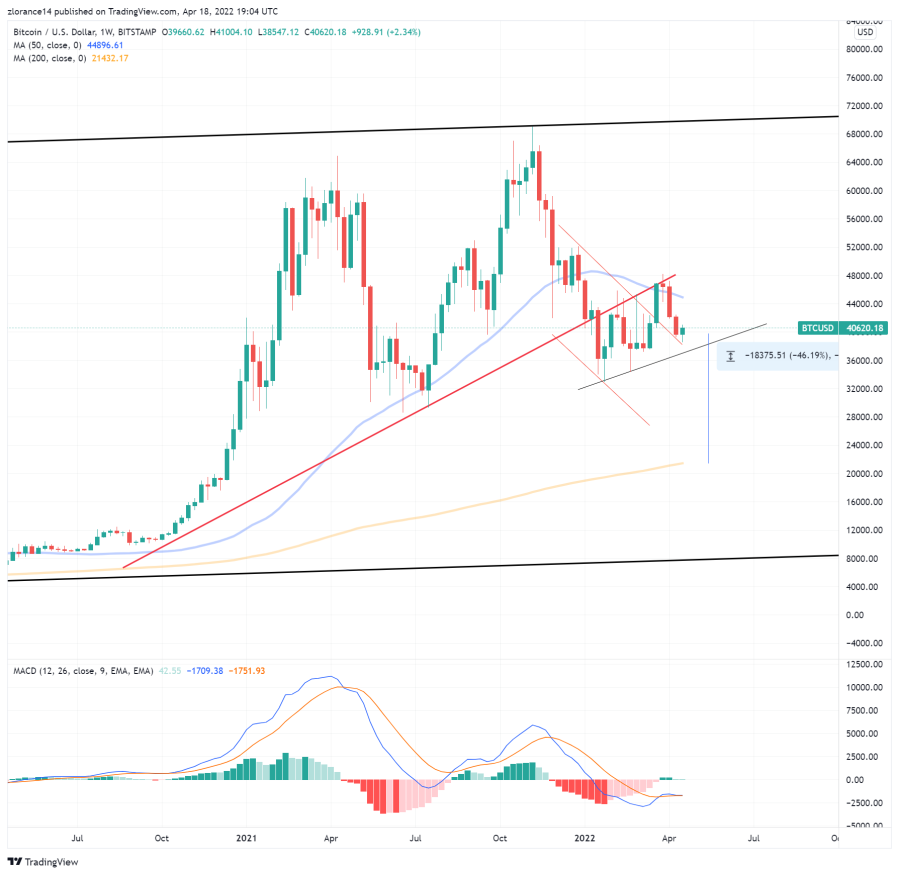
Despite the price action, long term indicators also point to Bitcoin having already peaked in November 2021. Bitcoin has shown signs of support, especially at the $40,000 USD level. However, momentum indicators show that volume is slowing and people are exiting the market overall.
Bitcoin needs a breakthrough of the ~$42,000 area to get above the 50 DMA.
The Bitcoin weekly chart is shown below:
Alt Coins
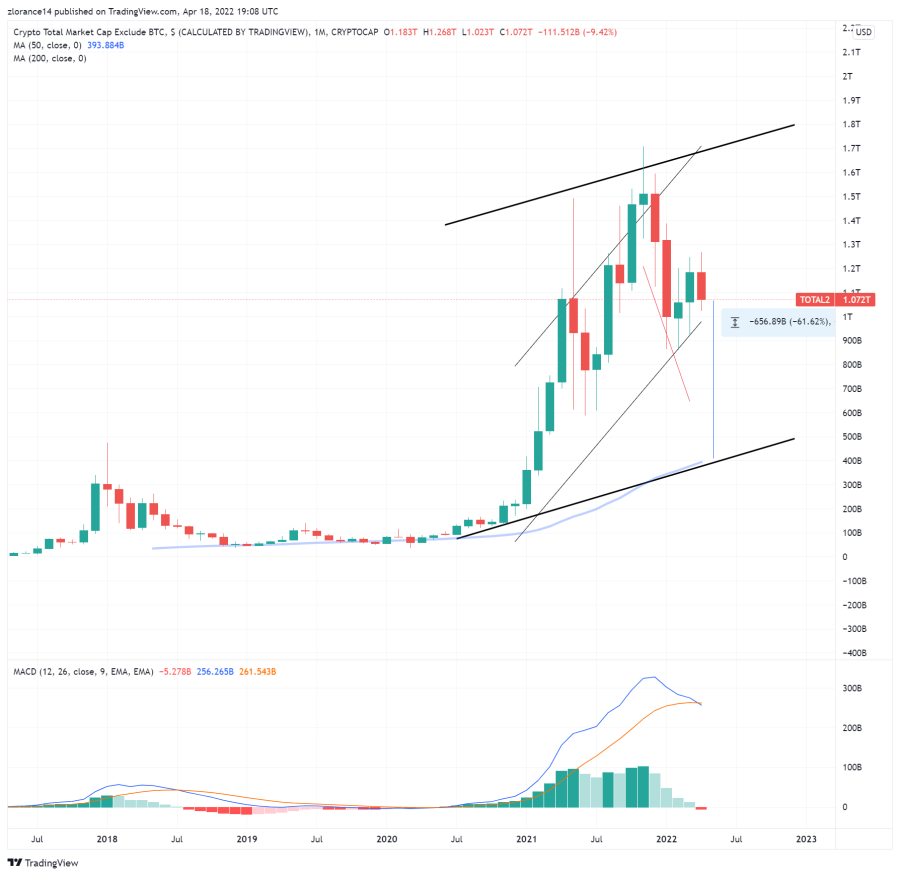
The altcoin market (total crypto market cap minus Bitcoin) has also finally shown signs of long term decline. Momentum has slowed significantly and the Alt Coin Market has fallen below its 50 week moving average.
More notably, the AltCoin Market has just crossed-over on the Monthly chart MACD - once again the first time since 2018.
The 200 week moving average is at ~$406 billion USD, down from current valuations of $1.07 trillion USD.
The total market cap, minus Bitcoin, is shown below:

Markets Summary
Long term technicals are showing an increasingly bearish future for the cryptocurrency market. The stock market (US500) has also shown these same cracks. The Total Crypto Market more than likely entered a bear market following the major top in November 2021.
With the bearish set-ups on monthly charts in major assets such as Bitcoin & Ethereum, it is increasingly likely we see negative-dominant price action in 2022. There is a realistic argument to be made on many assets for a 50% or greater decline in prices. This is, however, very speculative.
Crypto is closer to a breakout than price collapse, but needs building momentum and a strong market of retail buyers. Neither have been building for months. Momentum on Bitcoin peaked undoubtedly in May 2021 and has since seen lower lows each time.
Ethereum is very similar, having just crossed over the monthly chart MACD.
Although the future is highly uncertain, prepare for the growing probability of significant market downside. It is recommended to lower risk tolerance LONG TERM and balance portfolios for deflationary pressure. This is a recommendation and should not be considered investing advice.
Coming RekTimes Articles:
- Article on Near Network (TODAY)
- Article on MakerDAO (recently delayed but a fresh piece is coming in 1-2 weeks)
- RekTimes Weekly Markets 1.31
Long Term Projects
- Investigation on MOBI
- Research report on Ampleforth Stablecoin
- Q2 Summary Report

If you enjoyed this article, be sure to follow this page to be notified of our weekly postings
Use the QR codes below to tip in USD/BTC or send a tip through CoinTr.ee


Moose & Marsha Handcrafted Goods