It’s about three months since I joined Publish0x and due to my background in writing I was approved to write my blog almost immediately. Now that I have finished my first quarter, I conducted a study of how my posts have performed on the whole. I felt this was an opportune time, having written enough posts to create an adequate sample to provide the necessary analytics to drive my blog forwards and make my writing more attuned to the community.
Data was collected on 9th October 2020
The main headline is that up to that time I had written 58 posts with 76,476 views and in the meantime picked up 391 followers. My average daytime views are somewhere in the order of 850.
However, this doesn’t provide any really useful analytics and even the average number of views is a somewhat distorted figure as I have acquired more daily views as time has gone on. It probably took a couple of weeks to even get my first 850 views overall and using Publish0x’s own statistics my best daily views figure currently stands at 3000+.
For analysis I have broken my posts down into a number of categories, as follows.
- Tactics – Crypto tactics for growing your portfolio and managing downturns
- News – Information I have acquired through my own research on Crypto
- Business – general business topics and concepts
- Feedback – personal experiences and learning outcomes in my dealings with Crypto
- Technology – how technology can be used to improve data gathering and how future technology will impact the world we live in.
- General – as the label says, these are non-defined topics that might include short stories and travel biography among other topics.
Once done, I analysed how each category performed and here are the results (I have redacted the actual tips received as this was done only for my own analysis).

So what does this show us?
To help the reader understand the data I have highlighted the best in green, the expected in light orange and the worst in pink. The grey row at the top represents the total and while the other grey rows show a slight under-performance they are not the most dramatic examples.
The Green – Tactics
Posts written on tactics represent 41.38% of my posts (just over 2 in every 5 that I have written) and yet they represent approximately 58% of both my visits and the number of tips I have received. This is an over-performance (proportionally) of about 16% and is a strong indicator of what the community wants to read and learn more about.
In fact my top 3 posts (to date) in terms of visits all belong to this category:
- My TEZOs Coin Jar = Pure Delicious Profit! (4244 visits)
- Tactics for Newbies: Putting the Brakes On! (2914 visits)
- Tactics for Newbies: Suckling the Pig (2912 visits)
The Light Orange – Feedback
These figures are pretty flat and consistent all the way through with only a small -0.67% deviation on their proportional performance. There is some community interest in this as every experience is a learning experience and that includes learning from others.
The Red – General
This category represents 6% of my posts and yet only accounts for less than 1% of visits and only 0.63% of tips received. As a category its performance is extremely weak and, especially if receiving tips is a driving motivation, questions need to be raised as to the validity of continuing to write such posts on what is at the end of the day a Crypto driven platform.
Further Analysis – Confirming the Data
Another way of looking at the same data set is in the bar graph which I have produced below.
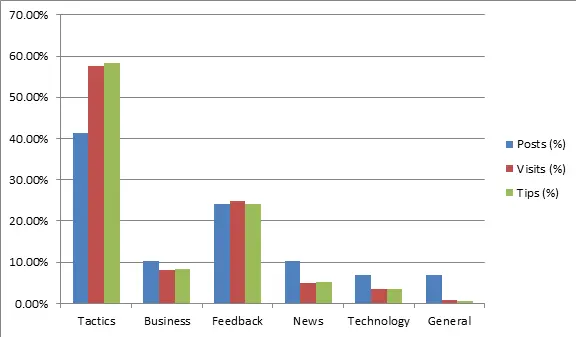
In many ways this data is easier to read than the table because quite simply the number of posts (blue) can be directly compared with the number of visits (red) and tips (green) received. Wherever the red and/or green bars are higher than the blue bar the category is exceeding proportional performance indicators. Of course the opposite is also true. A glance confirms what I have already concluded from the table – Tactics is a strong performer, Feedback more or less holds its own and among a number of under-performing categories General topics are not of much interest to the community.
Conclusions
This section almost writes itself. Publish0x is a Crypto blogging platform and hence most readers are predominantly interested in Crypto topics. We probably all pretty much suspected this anyway, but it is nice to have it confirmed. People are interested in both Crypto Education (in other words learning how to trade and leverage Crypto for their own benefit) and Feedback so once again they can learn from other people’s experience(s), both good and bad.
The lesson seems to be that we should only concentrate on these areas. However, for me I will probably continue to pursue even the under-performing categories as I run my own business website which I also write a lot of material for. So in my case (as it is still my original content) when it comes to General and Business topics it really is a case of copy, paste and publish with a minimum of work which means any yield is worth my while.
Hope this post has been both interesting and educational.
Stay well, stay safe and you will be hearing more from me soon and by the way if you are wondering this post goes into the Feedback category.