Ever wondered why all your TA tools combined can't tell you the exact "dip"?
We've all heard the term "buy the dip" like 1000 times. And these are pro analysts saying that.
So where exactly is "the dip"?
Defined, a dip is any literal 'dip' or drop in price. But there are dips and there are dips.
Let's look at an example chart I cherry picked just for this post.
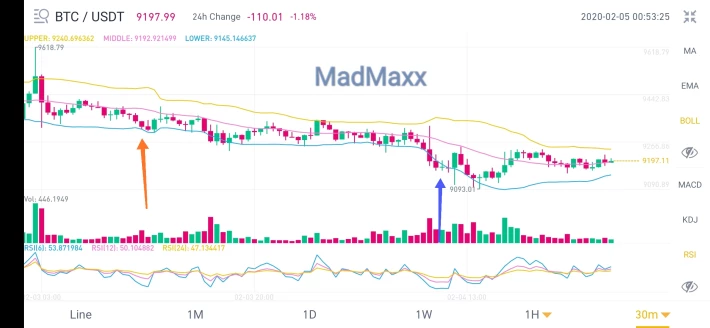
There was a dip at the orange arrow. And then another one at the blue arrow.
You're probably thinking:"What the heck? Those are miles apart!"
But believe it or not, if you had bought at the blue dip instead of the orange dip, you would have made significantly more profit had you sold at their subsequent highs.
What?
Buying at dip one would yield less profit than buying at dip two. (I love using technical English talk)
Ok. So how do you know which dip is best? When do you buy for God's sake?
It's really simple. Don't chase the dips.
The example I agave above was for one trade. Had you made another trade after buying at dip 1, your profits would have been 2x larger if you also bought at dip 2. Yes, 2x larger!
That said, there are tools that use complex mathematics to tell us when dips might be coming.
I don't really like complex, so I ignore those ones.
There are simple ones however. And I embrace those.
Here are a few, and when you should buy according to them.
1. RSI
RSI measures the state of the market. That is, overbought (≥70) or oversold(≤30) or neutral-ish(=50).
Using the RSI method, you might see a dip and the RSI stays on or above 50. This is a solid "don't buy" signal, and it works like magic.
You might also see a dip with the RSI much less than 30(say 15 or 10). This is also a solid "don't buy" signal. Why? Because going so low to those levels signifies that the market condition might be about to take a turn for the worse.
The best time to buy using RSI analysis is in the 30 zone, but you must see the RSI line rising or trying to rise. This method means that the market did dip, but is ready to rise again.
Those are the best dips to buy.
2. EMA
Listen, these things are underrated for real. They are leading indicators, which means that they can "predict" price to a certain level, and with a certain level of accuracy.
Here's how to use them to look at dips:
Plot a 5 and 15 EMA on your chart. These are fast and leading, so you have no problem with fake outs.
Next, you buy dips where the 5 EMA crosses over the 15 FROM THE BOTTOM. It's really essential it's from the bottom, because crossing from the top is a sell signal.
This method is almost as effective as the RSI, and gives you those clean looking graphs that the pros use.
Thanks for reading.