
Greetings! Today I will explain how to use indicator and plot functions with Pinescript in Tradingview!
* THE INTRODUCTION AND PREREQUISITES WILL BE IN EVERY PINESCRIPT TUTORIAL. IF YOU DON'T WANT TO READ THROUGH IT, SKIP. *
Introduction to Pinescript
Pinescript is a programming language specifically designed for creating indicators or strategies on trading view. This versatility makes Pinescript a very handy tool for most traders.
Even if you aren't looking to develop any large or complex strategy or indicator, learning simplify is very useful because you can create simple custom indicators to make the charts more readable and to read chart data faster. For example, you could be looking for every candle that went below the 200-EMA. With Pinescript, you could easily simplify that process by creating an indicator
Prerequisites
There aren't any prerequisites to learning pinescript because in my opinion it is simple enough to learn for beginners. However, learning any of the following programming languages below will allow you to learn pinescript easier.
- Basic Python knowledge (Helps with using the syntax)
- C++, C#, JAVA, C, or any statically typed language (Helps with datatypes) - This one is excessive, and you could learn datatypes on your own time without learning one of these.
- General programming concept knowledge (Conditionals, Loops, Methods (Functions), Variables)
Basic datatypes:
- int - an integer whole number either negative or positive.
- float - a decimal value either negative of positive
- string - a line of text with double quotes
- bool - a true/false value. This can only represent two possible values.
To get started, go on a random price chart in trading view, and click "Pine Editor" on the bottom left corner area.
The Indicator function
The indicator function is the first function you call in Pinescript v5 (Previously called "study") when creating any indicator to add to the charts.
This is the most simple, yet important function when using Pinescript. The Indicator function will determine the title of the indicator, the shorttitle (abbreviated) you see on the indicator list, whether the indicator will overlay or not, and etc. (There are many more you can do, but they are mostly unnecessary and you can search them up on documentation if you require it)
To use the indicator function, you simply need to do the following:
indicator()This will initialize it. Whenever calling any function in general, you would add a pair of paratheses after the function name, which the name in this case is "indicator"
Then to add parameters, you would do this:
indicator(title="Example Indicator")For this instance, I added the title, "Example Indicator" when calling the "Indicator" function. In this case, the title had to be set to a string value (Which is a line of text). The same process applies for each parameter, except other parameters will have different datatypes.
indicator(title="Example Indicator", shorttitle="EI", overlay=true)In this case, the shorttitle is also a string value, but the overlay is a Boolean value (Either true or false) and therefore can only be declared the same type.
The overlay parameter, when set to false, will create its own separate graph to plot on besides the price chart.
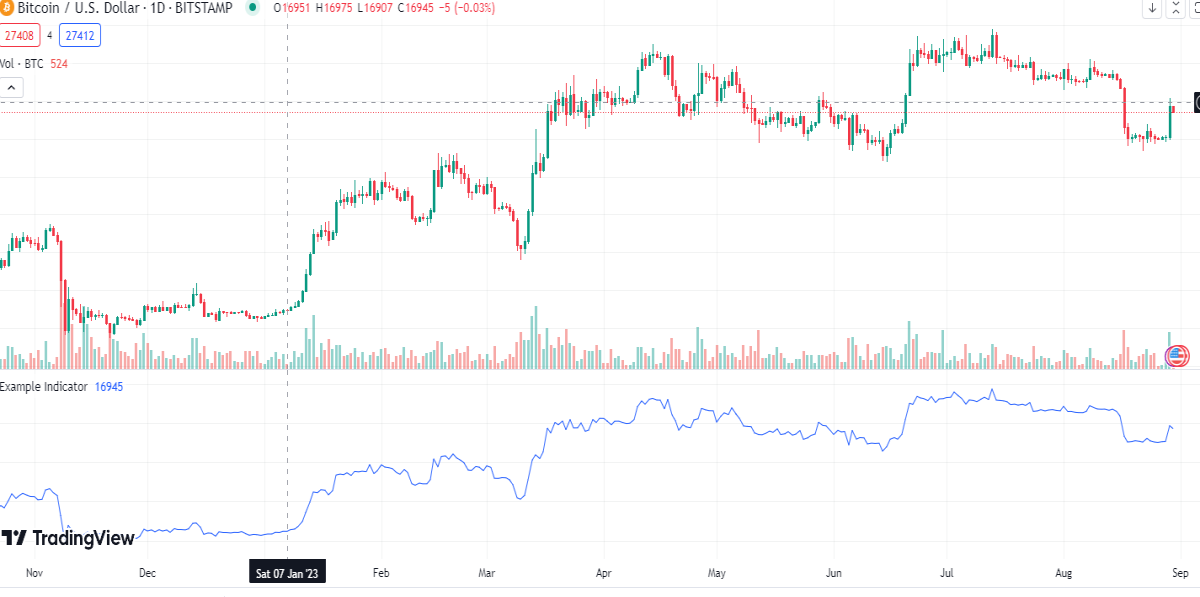
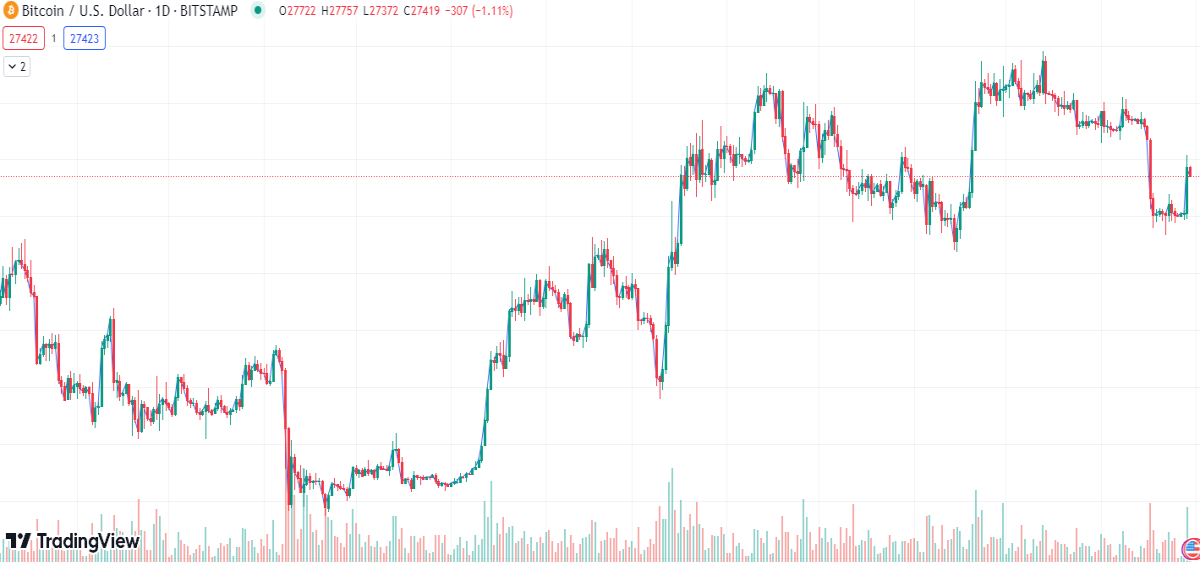
If set to true, it would do the opposite and plot on the price chart:
Keep in mind that so far, if you only call the indicator function, nothing will happen. This is due to the fact that you haven't called any plotting functions yet.
The plotting function
The plot function allows you to plot a line graph. It takes in many parameters like the indicator function, but only the series and color parameters are commonly used.
To call a plot function, you would do a similar thing like the indicator function.
plot()Afterwards, to add the series parameter, you should do something like this:
plot(series=close)In this case I set the series parameter to the "close" value. (The series parameter is the value in which the point of the plot is drawn at (Y) for that current candle)
Before I forget, there are a few environmental variables I would need to mention that are commonly used with the plot function.
* NOTE THAT THE ENTIRE CODE YOU WRITE OTHER THAN THE INDICATOR IS RUN FOR EACH BAR *
- close - gets the closing value of the candle it's on
- high - gets the highest value of the candle it's on
- low - gets the lowest value of the candle it's on
Since all of these are set to an int/float value. Using this, I can set the "series" parameter, which is an integer/float parameter, to the "close" environmental variable.
To add the color parameter, it is a little trickier.
plot(series=close, color=color.blue)The color parameter has to be set to a "color" type. The "color" type is used by first writing out "color" and then accessing the desired color.
For example, in this instance, I could have set color to color.green, color.red, and etc.
End Conclusion:
By the end of this, you should have a program looking like this:
indicator(title="Example Indicator", shorttitle="EI", overlay=true)
plot(series=close, color=color.blue)
However, as practice, you should change around the parameters. For example, you could change the title and shorttitle to other strings like "cake" or whatever line of text you want.
I hope you learned a lot from this tutorial, and I will be seeing you soon :)


