
The bulls made a big move and continue to break barriers upwards, today I will focus on the Bitcoin chart.
Three days ago, a significant movement happened on the Bitcoin chart, a reversal in the 100-period moving average, Is it responsible for the increase in Bitcoin today?
Understand the case
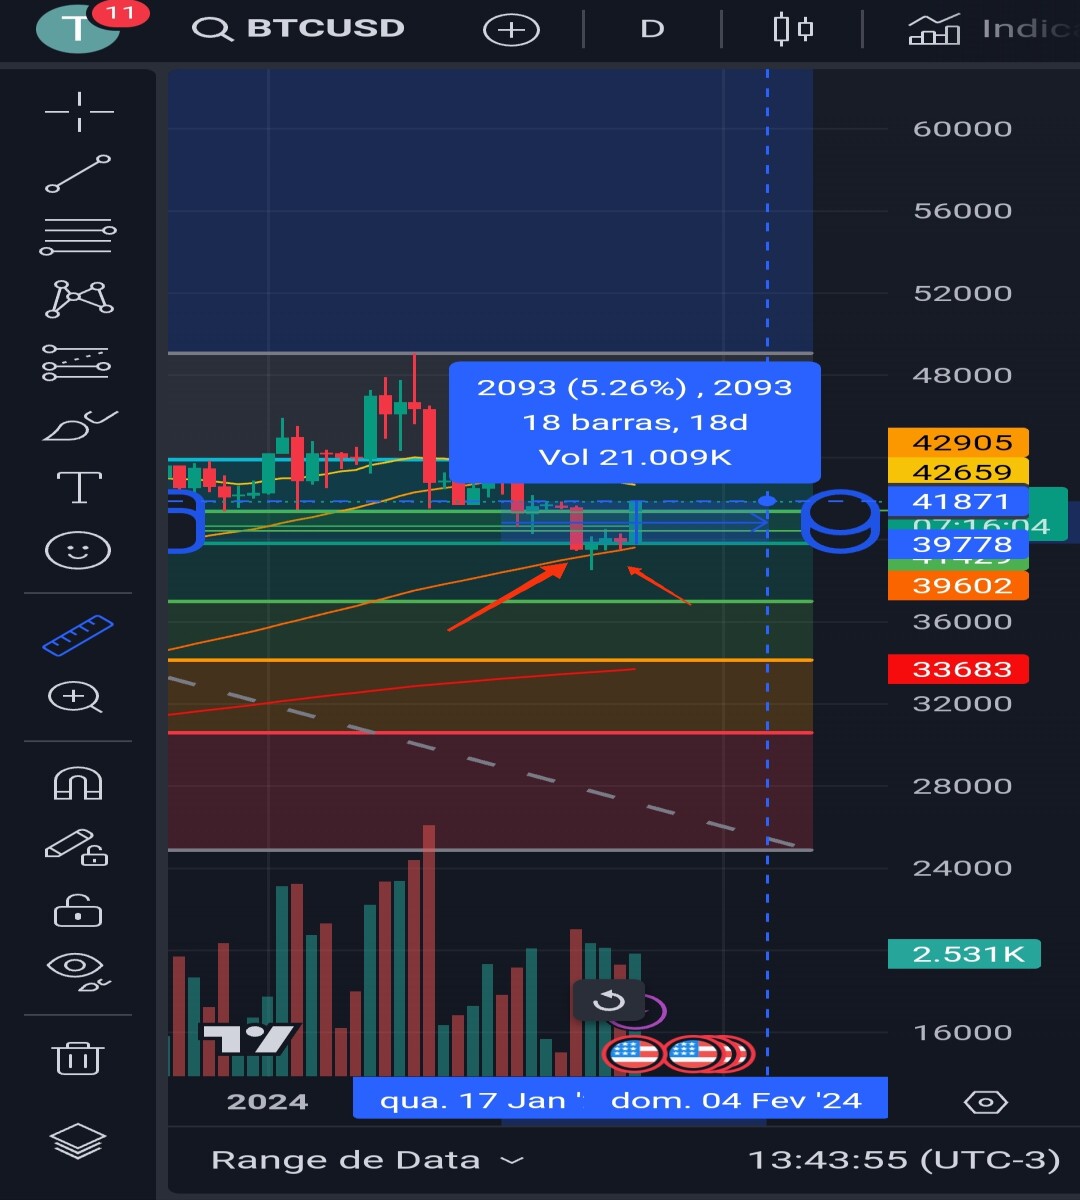
Bitcoin was on a very big decline, took a long breath and dropped below 40k. But it's not that simple for the bears to keep their foot on the gas. The pattern formed three days ago shows an enormous strength of the MVA100, creating a strong pattern of candles that already showed the attentive eye what was to come. Note the bullish hammer formed at the bottom of the price, followed by a bullish confirmation candle.
Scholars do not regret
This part of the text is intended for those who study the market, because we, even though we sometimes lose, gain something valuable, "The knowledge". Patients saw the pattern, entered its confirmation and were able to withdraw gains within a single candle that already passed the resistance point in a Fibonacci.
I hope you liked my content, subscribe to help this analyst. I am a young investor who lives in this market. If you could help with my wedding, I would appreciate it and I promise to bring more content and do more analysis. See you soon!
BTC Address Bitcoin Network
1EUyKfGoLE9BVuwy4ei4Wax33htNoqxvSM
BNB Address BEP20
0xdb89e044565180d430234e40f1982b81f0c7e430
ETH Address ERC20
0xdb89e044565180d430234e40f1982b81f0c7e430


