
On 16 july the Zcash had a big event of Heartwood Network Upgrade and at the same time the price action was moving down after trying to break out the resistance of an up channel. You can find this event on the different sites as in trending and hot events.
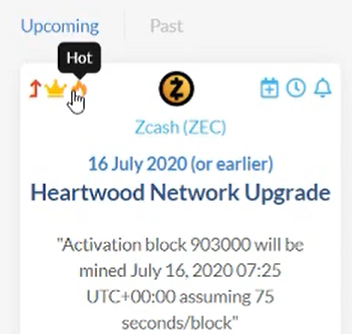
https://coinmarketcal.com/en/coin/zcash
For more details you can directly visit:
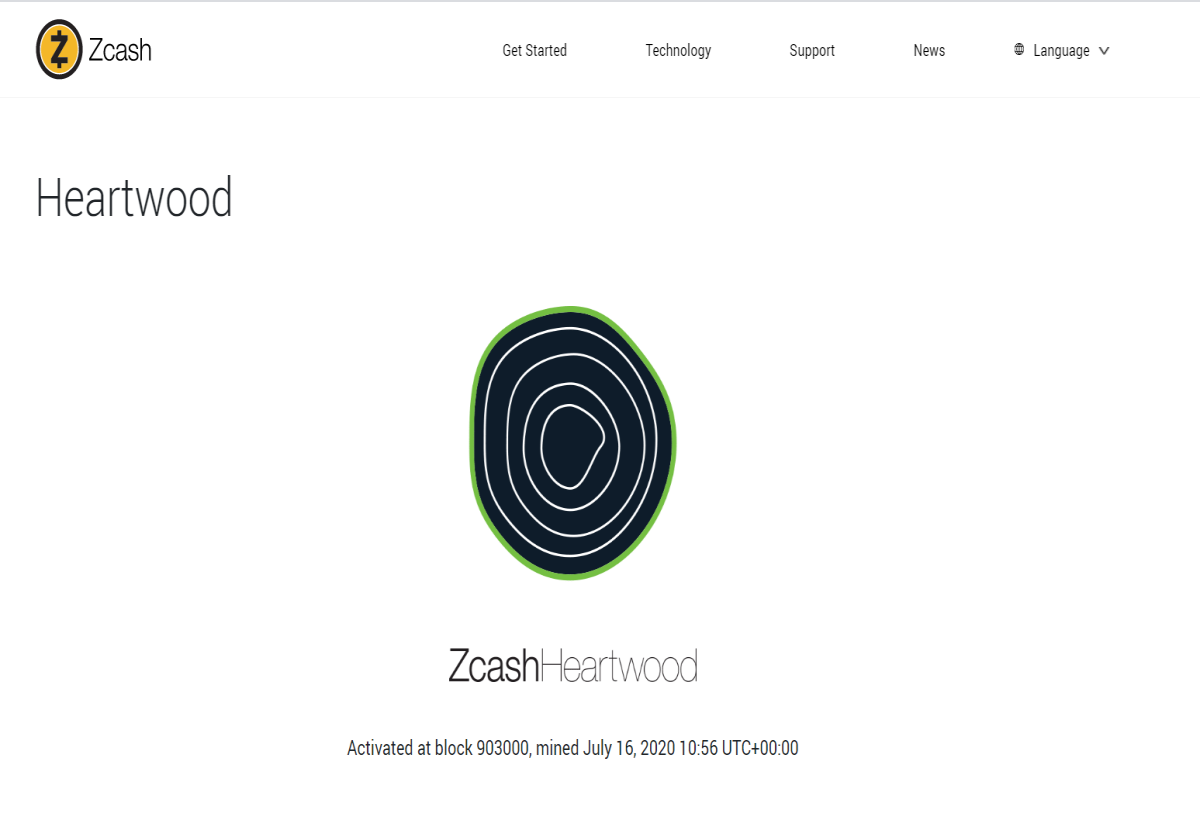
https://z.cash/upgrade/heartwood/
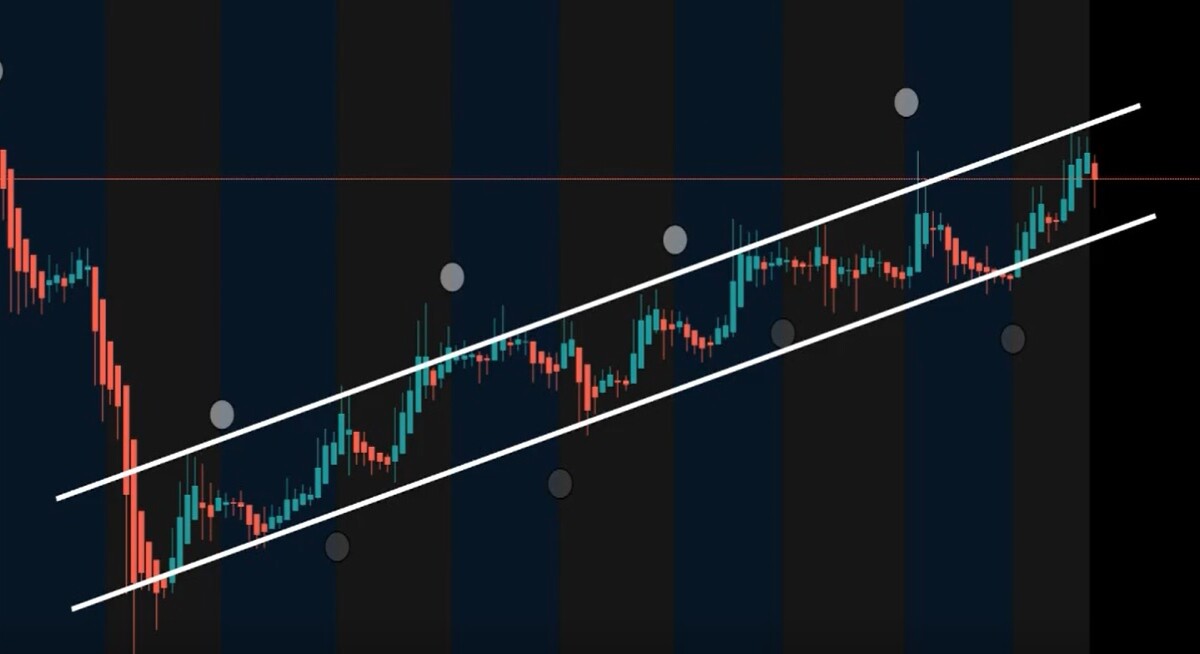
Up channel and bullish and bearish signals:
I have also placed the moon phases indicator to predict whether the price action will break out or break down the resistance or support of the channel. We can observe that the new full moon has appeared at a very high altitude and there is a big distance between the resistance of the channel and the new full moon. If you watch the dark moon that is also appeared below the support of the channel, therefore, we are having two opposite signals at the same time that the price action can breakout the resistance and also can break down the support. However, if the price action will not be able to break out or break down and still move within this channel then eventually the price will be increased because, in fact, it is an up channel.
The SMAs will not let the priceline to breakdown the support:
If we watch the simple moving averages with the time period of 25,50 100 and 200. Then we have the very strong support of all these four moving averages just below the price line. Therefore it will be difficult for the price action of Zcash to break down all these moving averages and break down the support of the channel. Moreover, we have the smallest time period moving average with the time period of 25 above all then we have 50 then 100 and then 200 SMA below all the other simple moving average. Therefore a complete opened alligator mouth by the simple moving averages has been formed. That is a very strong bullish signal.
Big bullish Gartley move:
Now I would like to draw your attention towards a very big bullish Gartley pattern that has been formed by the priceline of Zcash on the monthly chart. The price action of ZEC coin is likely to be geared up from the potential reversal zone of this pattern and as per the Fibonacci sequence of this Gartley pattern the buying and sell targets can be as below:
Buy between: $57.06 to $38.79
Sell between: $71.44 to $105.97

Click here to create free account on tradingview to watch and play the chart on realtime
Conclusion:
The price action of Zcash is completely in uptrend on the daily chart. As it is moving in an up channel and having strong supports of different simple moving averages as well. However we should use the support of the channel as our stop loss in order to minimize the risk factor.
Note: This idea is education purpose only and not intended to be investment advice, please seek a duly licensed professional and do you own research before any investment.
Don't forget to follow my blog as below:


